1) Q1 2016 Catastrophe
Bond & ILS Market Report
Another record first-quarter
ARTEMIS
Focused on insurance-linked securities (ILS), catastrophe bonds,
alternative reinsurance capital and related risk transfer markets.
CO- EDITOR:
www.artemis.bm
�
2) B E R M U D A
THE WORLD’S
CONVERGENCE
C A P I T A L
Visionary industry leaders. Sophisticated infrastructure.
Speed to market. A hub of talent, experience and innovation.
Bermuda is a blue-chip financial centre built on pioneering ideas
and globally respected regulation. We attract the world’s leading
underwriters and asset managers—a natural nexus for convergence
of reinsurance and financial markets.
With more than 70 percent of global insurance-linked securities listed,
Bermuda is a centre of excellence for the creation, support and listing of
cat bonds, collateralized reinsurance, derivative instruments and other
unique vehicles. Does your capital belong here?
Learn more at bda.bm
Connecting Business
Maxwell Roberts Building, 6th Floor
1 Church Street
Hamilton HM 11
Bermuda
+ 1 4 41 292 0 632
info@bda.bm
w w w.bda.bm
�
3) INTRO
This report reviews the catastrophe bond and insurance-linked
securities (ILS) market at the end of the first-quarter of 2016, looking
at new risk capital issued and the composition of transactions
completed during the quarter.
For the first time in its history the catastrophe bond and ILS market has
ended a quarter with more than $26 billion of outstanding market capacity,
driven by a record-breaking start to the year that saw $2.215 billion of new
risk capital issued from ten transactions, lifting the outstanding market to
$26.516 billion at the end of March 2016.
The first-quarter is often a busy period for the sector as renewal deals come
to market. An impressive $800 million of deals were issued during January, the
second strongest January issuance volume ever recorded by Artemis, but more
than $1.4 billion of new deals in February and March helped the market achieve
outright growth once again.
Despite a substantial lack of privately placed deal issuance (or disclosure) in Q1
2016, particularly when compared to a year earlier when almost half of new
deals issued were considered private, sponsor and investor appetite clearly
remained strong during the quarter keeping the market on its impressive
growth path.
Artemis is the leading, freely accessible source of timely, relevant and
authoritative news, analysis, insight and data on the insurance-linked
securities, catastrophe bond, alternative reinsurance capital and related risk
transfer markets. The Artemis Deal Directory is the leading, freely available
source of information, data and analysis on issued catastrophe bond and
insurance-linked securitization transactions.
�
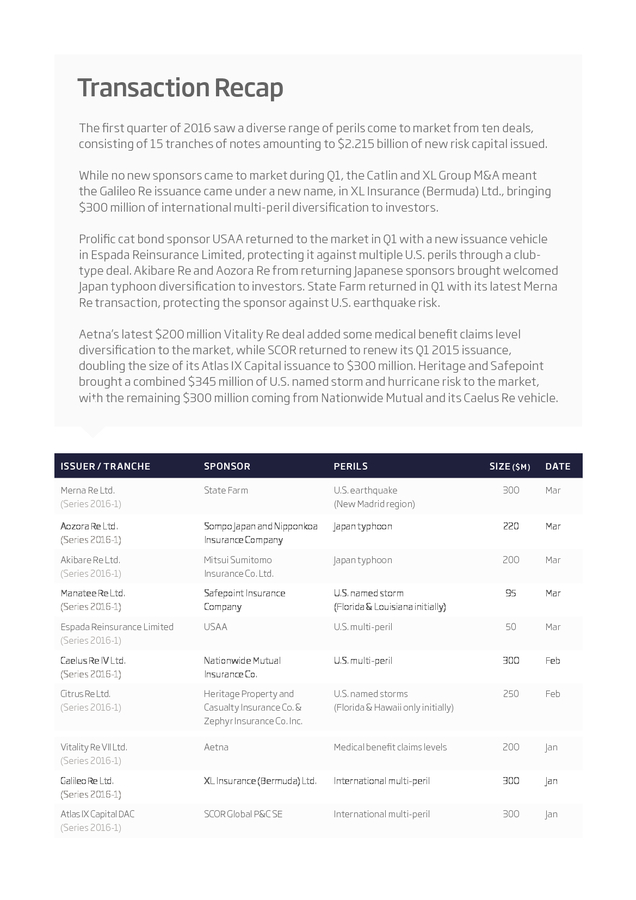
4) Transaction Recap
The first quarter of 2016 saw a diverse range of perils come to market from ten deals,
consisting of 15 tranches of notes amounting to $2.215 billion of new risk capital issued.
While no new sponsors came to market during Q1, the Catlin and XL Group M&A meant
the Galileo Re issuance came under a new name, in XL Insurance (Bermuda) Ltd., bringing
$300 million of international multi-peril diversification to investors.
Prolific cat bond sponsor USAA returned to the market in Q1 with a new issuance vehicle
in Espada Reinsurance Limited, protecting it against multiple U.S. perils through a clubtype deal. Akibare Re and Aozora Re from returning Japanese sponsors brought welcomed
Japan typhoon diversification to investors. State Farm returned in Q1 with its latest Merna
Re transaction, protecting the sponsor against U.S. earthquake risk.
Aetna’s latest $200 million Vitality Re deal added some medical benefit claims level
diversification to the market, while SCOR returned to renew its Q1 2015 issuance,
doubling the size of its Atlas IX Capital issuance to $300 million. Heritage and Safepoint
brought a combined $345 million of U.S. named storm and hurricane risk to the market,
with the remaining $300 million coming from Nationwide Mutual and its Caelus Re vehicle.
ISSUER / TRANCHE
SPONSOR
PERILS
SIZE ($M)
DATE
Merna Re Ltd.
(Series 2016-1)
State Farm
U.S. earthquake
(New Madrid region)
300
Mar
Aozora Re Ltd.
(Series 2016-1)
Sompo Japan and Nipponkoa
Insurance Company
Japan typhoon
220
Mar
Akibare Re Ltd.
(Series 2016-1)
Mitsui Sumitomo
Insurance Co. Ltd.
Japan typhoon
200
Mar
Manatee Re Ltd.
(Series 2016-1)
Safepoint Insurance
Company
U.S. named storm
(Florida & Louisiana initially)
95
Mar
Espada Reinsurance Limited
(Series 2016-1)
USAA
U.S. multi-peril
50
Mar
Caelus Re IV Ltd.
(Series 2016-1)
Nationwide Mutual
Insurance Co.
U.S. multi-peril
300
Feb
Citrus Re Ltd.
(Series 2016-1)
Heritage Property and
Casualty Insurance Co. &
Zephyr Insurance Co. Inc.
U.S. named storms
(Florida & Hawaii only initially)
250
Feb
Vitality Re VII Ltd.
(Series 2016-1)
Aetna
Medical benefit claims levels
200
Jan
Galileo Re Ltd.
(Series 2016-1)
XL Insurance (Bermuda) Ltd.
International multi-peril
300
Jan
Atlas IX Capital DAC
(Series 2016-1)
SCOR Global P&C SE
International multi-peril
300
Jan
�
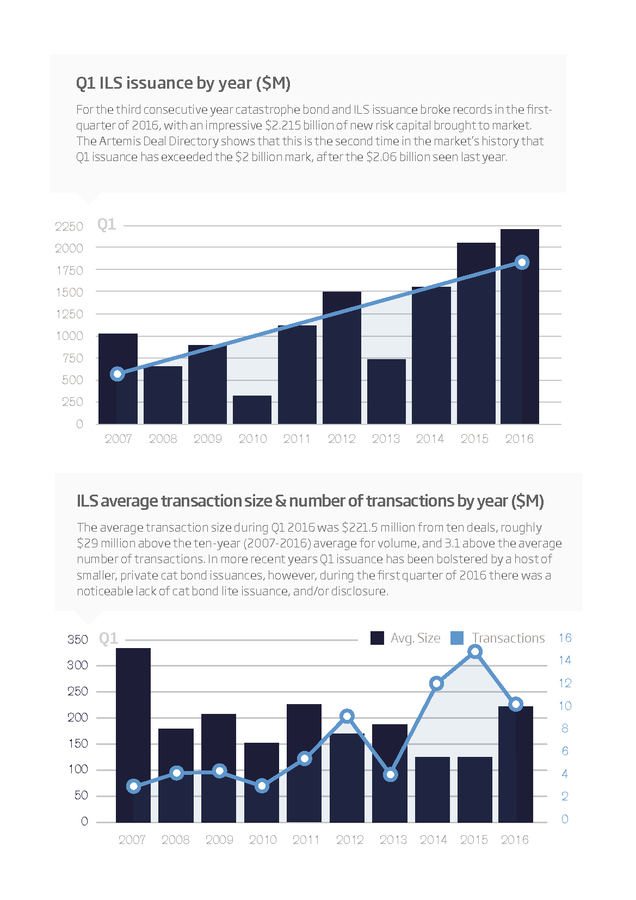
5) Q1 ILS issuance by year ($M)
For the third consecutive year catastrophe bond and ILS issuance broke records in the firstquarter of 2016, with an impressive $2.215 billion of new risk capital brought to market.
The Artemis Deal Directory shows that this is the second time in the market’s history that
Q1 issuance has exceeded the $2 billion mark, after the $2.06 billion seen last year.
2250
Q1
2000
1750
1500
1250
1000
750
500
250
0
2007
2008
2009
2010
2011
2012
2013
2014
2015
2016
ILS average transaction size & number of transactions by year ($M)
The average transaction size during Q1 2016 was $221.5 million from ten deals, roughly
$29 million above the ten-year (2007-2016) average for volume, and 3.1 above the average
number of transactions. In more recent years Q1 issuance has been bolstered by a host of
smaller, private cat bond issuances, however, during the first quarter of 2016 there was a
noticeable lack of cat bond lite issuance, and/or disclosure.
350
Avg. Size
Q1
Transactions 16
14
300
12
250
10
200
8
150
6
100
4
50
2
0
0
2007
2008
2009
2010
2011
2012
2013
2014
2015
2016
�
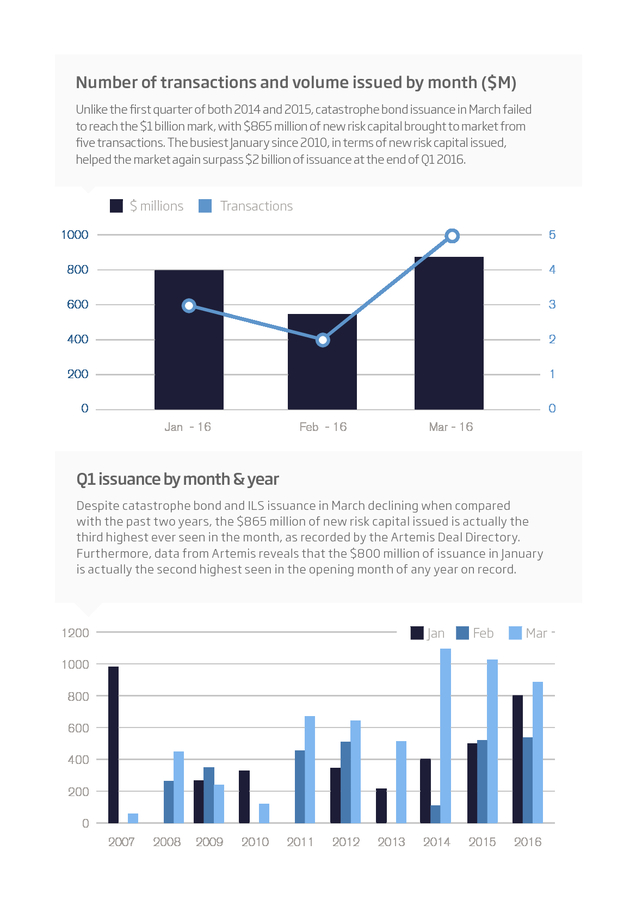
6) Number of transactions and volume issued by month ($M)
Unlike the first quarter of both 2014 and 2015, catastrophe bond issuance in March failed
to reach the $1 billion mark, with $865 million of new risk capital brought to market from
five transactions. The busiest January since 2010, in terms of new risk capital issued,
helped the market again surpass $2 billion of issuance at the end of Q1 2016.
$ millions
Transactions
1000
5
800
4
600
3
400
2
200
1
0
0
Jan - 16
Feb - 16
Mar - 16
Q1 issuance by month & year
Despite catastrophe bond and ILS issuance in March declining when compared
with the past two years, the $865 million of new risk capital issued is actually the
third highest ever seen in the month, as recorded by the Artemis Deal Directory.
Furthermore, data from Artemis reveals that the $800 million of issuance in January
is actually the second highest seen in the opening month of any year on record.
Jan
1200
Feb
2014
2015
Mar
1000
800
600
400
200
0
2007
2008
2009
2010
2011
2012
2013
2016
�
7) �
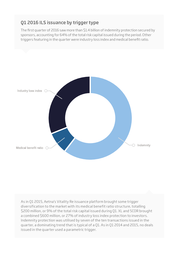
8) Q1 2016 ILS issuance by trigger type
The first quarter of 2016 saw more than $1.4 billion of indemnity protection secured by
sponsors, accounting for 64% of the total risk capital issued during the period. Other
triggers featuring in the quarter were industry loss index and medical benefit ratio.
Industry loss index
Medical benefit ratio
Indemnity
As in Q1 2015, Aetna’s Vitality Re issuance platform brought some trigger
diversification to the market with its medical benefit ratio structure, totalling
$200 million, or 9% of the total risk capital issued during Q1. XL and SCOR brought
a combined $600 million, or 27% of industry loss index protection to investors.
Indemnity protection was utilised by seven of the ten transactions issued in the
quarter, a dominating trend that is typical of a Q1. As in Q1 2014 and 2015, no deals
issued in the quarter used a parametric trigger.
�
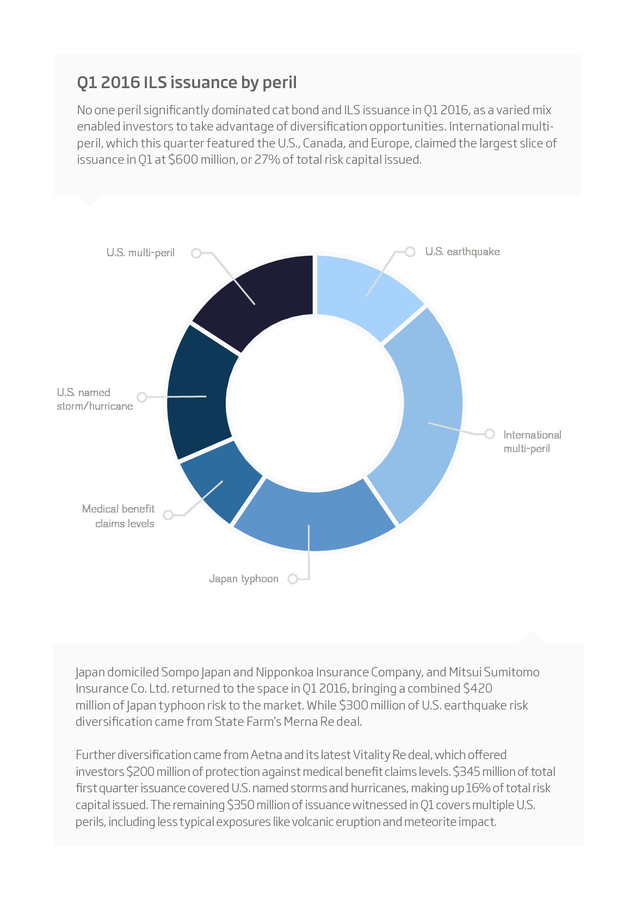
9) Q1 2016 ILS issuance by peril
No one peril significantly dominated cat bond and ILS issuance in Q1 2016, as a varied mix
enabled investors to take advantage of diversification opportunities. International multiperil, which this quarter featured the U.S., Canada, and Europe, claimed the largest slice of
issuance in Q1 at $600 million, or 27% of total risk capital issued.
U.S. earthquake
U.S. multi-peril
U.S. named
storm/hurricane
International
multi-peril
Medical benefit
claims levels
Japan typhoon
Japan domiciled Sompo Japan and Nipponkoa Insurance Company, and Mitsui Sumitomo
Insurance Co. Ltd. returned to the space in Q1 2016, bringing a combined $420
million of Japan typhoon risk to the market. While $300 million of U.S. earthquake risk
diversification came from State Farm’s Merna Re deal.
Further diversification came from Aetna and its latest Vitality Re deal, which offered
investors $200 million of protection against medical benefit claims levels. $345 million of total
first quarter issuance covered U.S. named storms and hurricanes, making up 16% of total risk
capital issued. The remaining $350 million of issuance witnessed in Q1 covers multiple U.S.
perils, including less typical exposures like volcanic eruption and meteorite impact.
�
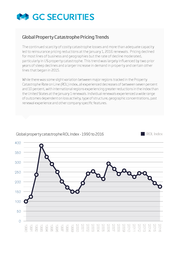
10) Global Property Catastrophe Pricing Trends
The continued scarcity of costly catastrophe losses and more than adequate capacity
led to reinsurance pricing reductions at the January 1, 2016 renewals. Pricing declined
for most lines of business and geographies but the rate of decline moderated,
particularly in US property catastrophe. This trend was largely influenced by two prior
years of steep declines and a larger increase in demand in property and certain other
lines that began in 2015.
While there was some slight variation between major regions tracked in the Property
Catastrophe Rate on Line (ROL) index, all experienced decreases of between seven percent
and 10 percent, with international regions experiencing greater reductions in the index than
the United States at the January 1 renewals. Individual renewals experienced a wide range
of outcomes dependent on loss activity, type of structure, geographic concentrations, past
renewal experience and other company specific features.
ROL Index
Global property catastrophe ROL Index - 1990 to 2016
400
350
300
250
200
150
100
50
0
2016
2015
2014
2013
2012
2011
2010
2009
2008
2007
2006
2005
2004
2003
2002
2001
2000
1999
1998
1997
1996
1995
1994
1993
1992
1991
1990
�
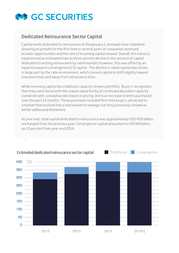
11) Dedicated Reinsurance Sector Capital
Capital levels dedicated to reinsurance at the January 1 renewals have stabilized,
showing no growth for the first time in several years as companies assessed
broader opportunities and the rate of incoming capital slowed. Overall, the industry
experienced an estimated two to three percent decline in the amount of capital
dedicated to writing reinsurance by rated markets however, this was offset by an
equal increase in convergence (ILS) capital. The decline in rated capital was driven
in large part by the rate environment, which caused capital to shift slightly toward
insurance lines and away from reinsurance lines.
While incoming capital has stabilized, capacity remains plentiful. Buyers’ recognition
that they were faced with the unique opportunity of continued abundant capacity
75%
70%
combined with cumulative decreases in pricing, led to an increase in limits purchased
over the past 12 months. These purchases included first time buyers, attracted to
a market that evolved into a mechanism to manage risk they previously viewed as
better addressed elsewhere.
At year-end, total capital dedicated to reinsurance was approximately USD 400 billion,
unchanged from the previous year. Convergence capital amounted to USD 68 billion,
up 13 percent from year-end 2014.
Estimated dedicated reinsurance sector capital
400
Traditional
Convergence
$B
350
300
250
200
150
100
50
0
2012
2013
2014
2015 E
�
12) 2016 Outlook
As the pricing environment showed signs of stabilization across both the
insurance-linked securities (ILS) and traditional markets, accessing multi-year
capacity at pre-agreed static rates is a focus for many cedents.
A significant and growing number of property programs were placed at least partially
on a multi-year basis at January 1 and notably, multi-year options are beginning to
emerge in some casualty sectors, where they have not been available in the past.
The capital markets are also in a strong position to provide multi-year capacity, and
2016 is expected to bring new opportunities in the ILS space for public sector entities,
corporates, insurers and reinsurers.
GC Securities, is a division of MMC Securities Corp., member FINRA/NFA/SIPC, main office: 1166 Avenue of the
Americas, New York, NY 10036, phone: 212.345.5000. MMC Securities Corp. and Guy Carpenter & Company, LLC are
affiliates and wholly owned by Marsh & McLennan Companies.
�
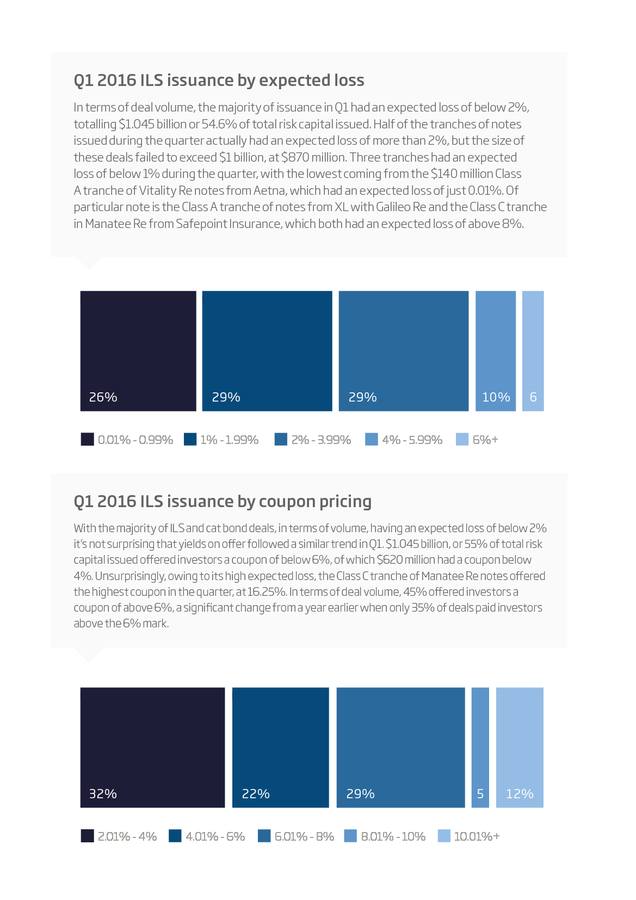
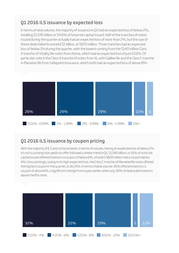
13) Q1 2016 ILS issuance by expected loss
In terms of deal volume, the majority of issuance in Q1 had an expected loss of below 2%,
totalling $1.045 billion or 54.6% of total risk capital issued. Half of the tranches of notes
issued during the quarter actually had an expected loss of more than 2%, but the size of
these deals failed to exceed $1 billion, at $870 million. Three tranches had an expected
loss of below 1% during the quarter, with the lowest coming from the $140 million Class
A tranche of Vitality Re notes from Aetna, which had an expected loss of just 0.01%. Of
particular note is the Class A tranche of notes from XL with Galileo Re and the Class C tranche
in Manatee Re from Safepoint Insurance, which both had an expected loss of above 8%.
v
v
26%
0.01% - 0.99%
29%
29%
1% - 1.99%
2% - 3.99%
10%
4% - 5.99%
6
6%+
Q1 2016 ILS issuance by coupon pricing
With the majority of ILS and cat bond deals, in terms of volume, having an expected loss of below 2%
it’s not surprising that yields on offer followed a similar trend in Q1. $1.045 billion, or 55% of total risk
capital issued offered investors a coupon of below 6%, of which $620 million had a coupon below
4%. Unsurprisingly, owing to its high expected loss, the Class C tranche of Manatee Re notes offered
the highest coupon in the quarter, at 16.25%. In terms of deal volume, 45% offered investors a
coupon of above 6%, a significant change from a year earlier when only 35% of deals paid investors
above the 6% mark.
v
v
32%
2.01% - 4%
22%
4.01% - 6%
29%
6.01% - 8%
8.01% - 10%
5
10.01%+
12%
�
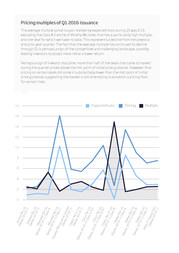
14) Pricing multiples of Q1 2016 issuance
The average multiple (price coupon divided by expected loss) during Q1 was 2.12,
excluding the Class A tranche of Vitality Re notes that has a particularly high multiple,
and one deal for which we have no data. This represents a decline from the previous
and prior year quarter. The fact that the average multiple has continued to decline
through Q1 is perhaps a sign of the competitive and challenging landscape, possibly
leading investors to accept more risk at a lower return.
Perhaps a sign of investor discipline, more than half of the deals that came to market
during the quarter priced above the mid-point of initial price guidance. However, final
pricing on certain deals did come in substantially lower than the mid-point of initial
price guidance, suggesting the market is still attempting to establish a pricing floor
for certain risks.
18
Expected Loss
Pricing
Multiple
16
14
12
10
8
6
4
2
A
(Se ozora
ries Re
20 Ltd
16 .
-1)
Ak
iba
(Se
re R
ries
20 e Ltd
16 .
(Se
-1)
ries Man
20 atee
16
Re
-1)
Cla Ltd.
(Se
ss
A
ries Man
20 atee
16
Esp
-1) Re L
ada
Cla td.
Re
ss
ins
C
ura
nce
(Se
ries Lim
20 ited
16
-1)
Ca
elu
(Se s R
ries e IV
(Se
20 Ltd
16 .
ries
-1)
20
16 Citru
-1)
sR
Cla e L
(Se
ss
D -5 td.
ries
0
20
16 Citru
-1)
s
Cla Re L
ss
E-5 td.
(Se
0
ries Vitali
20 ty R
16 e V
-1)
II L
Cla td.
(Se
ss
B
ries
G
20 alileo
16
-1) Re L
Cla td.
(Se
ss
A
ries
Ga
20 lileo
16
Re
-1)
Cla Ltd.
(Se
ss
B
ries
Ga
20 lileo
16
-1) Re L
Cla td.
Atla
ss
s IX
C
Ca
(Se
pita
ries
lD
20 AC
16
-1)
0
�
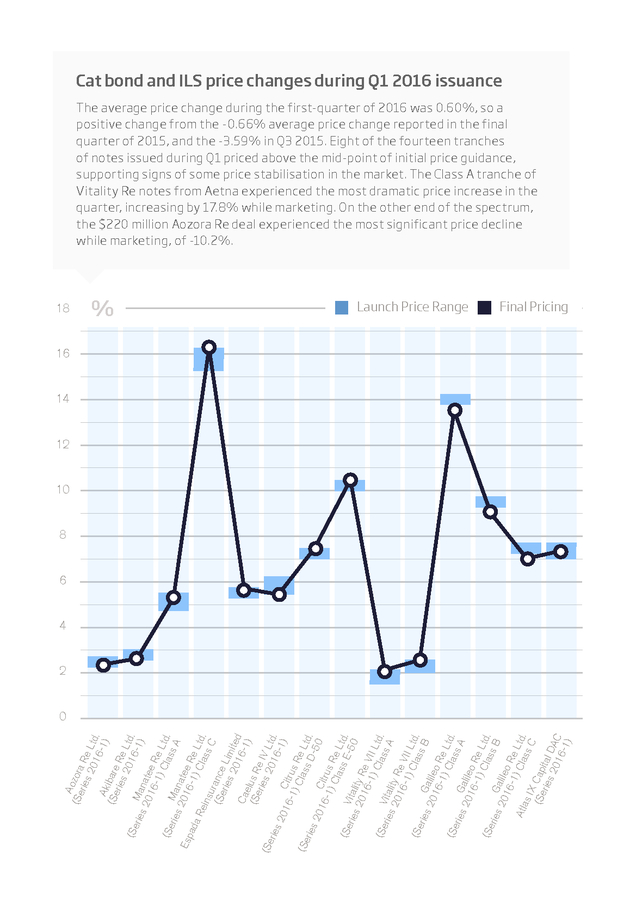
15) Cat bond and ILS price changes during Q1 2016 issuance
The average price change during the first-quarter of 2016 was 0.60%, so a
positive change from the -0.66% average price change reported in the final
quarter of 2015, and the -3.59% in Q3 2015. Eight of the fourteen tranches
of notes issued during Q1 priced above the mid-point of initial price guidance,
supporting signs of some price stabilisation in the market. The Class A tranche of
Vitality Re notes from Aetna experienced the most dramatic price increase in the
quarter, increasing by 17.8% while marketing. On the other end of the spectrum,
the $220 million Aozora Re deal experienced the most significant price decline
while marketing, of -10.2%.
18
%
Launch Price Range
Final Pricing
16
14
12
10
8
6
4
2
A
(Se ozora
ries Re
20 Ltd
16 .
-1)
Ak
(Se ibare
ries Re
20 Ltd
(Se
16 .
-1)
ries Man
20 atee
16
Re
-1)
Cla Ltd.
(Se
ss
ries Man
A
20 atee
Esp
16
Re
ada
-1)
Ltd
Cla
Re
ins
ss .
u
C
(Se rance
ries Lim
20 ited
16
Ca
-1)
e
(Se lus R
ries e IV
(Se
20 Ltd
ries
16 .
-1)
20
16 Citru
-1)
sR
Cla e L
(Se
ss
ries
D -5 td.
20
0
16 Citru
-1)
sR
Cla e L
ss
(Se
E-5 td.
ries Vitali
0
20 ty R
16 e V
-1)
II L
Cla td.
(Se
ss
ries Vitali
A
20 ty R
16 e V
-1)
II L
Cla td.
(Se
ss
ries
G
B
20 alileo
16
-1) Re L
Cla td.
(Se
ss
ries
G
A
20 alileo
16
Re
-1)
Cla Ltd.
(Se
ss
ries
B
G
20 alileo
16
Re
-1)
Ltd
Cla
Atla
ss .
s IX
C
(Se Cap
ries ital
20 DAC
16
-1)
0
�
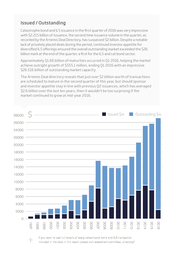
16) Issued / Outstanding
Catastrophe bond and ILS issuance in the first quarter of 2016 was very impressive
with $2.215 billion of issuance, the second time issuance volume in the quarter, as
recorded by the Artemis Deal Directory, has surpassed $2 billion. Despite a notable
lack of privately placed deals during the period, continued investor appetite for
diversified ILS offerings ensured the overall outstanding market exceeded the $26
billion mark at the end of the quarter, a first for the ILS and cat bond sector.
Approximately $1.66 billion of maturities occurred in Q1 2016, helping the market
achieve outright growth of $555.1 million, ending Q1 2016 with an impressive
$26.516 billion of outstanding market capacity.
The Artemis Deal directory reveals that just over $2 billion worth of transactions
are scheduled to mature in the second quarter of this year, but should sponsor
and investor appetite stay in line with previous Q2 issuances, which has averaged
$2.6 billion over the last ten years, then it wouldn’t be too surprising if the
market continued to grow at mid-year 2016.
28000
$
Issued $m
Outstanding $m
26000
24000
22000
20000
18000
16000
14000
12000
10000
8000
6000
4000
2000
0
2016
2015
2014
If you want to see full details of every catastrophe bond and ILS transaction
included in the data in this report please visit www.artemis.bm/deal_directory/
2013
2012
2011
2010
2009
2008
2007
2006
2005
2004
2003
2002
2001
2000
1999
1998
1997
+
�
17) A Leader in Collateral Trustee and
Insurance Linked Securities Services
As a leading provider of trust and agency services, we have the Collateral Trustee
and CAT Bond administration expertise to help reinsurers and the sponsors of
Insurance Linked Securities (ILS) meet their alternative capital funding needs.
We act as collateral trustee and in various agency capacities to deliver product
solutions for insurance and reinsurance companies, and support a wide range of
ILS activity, including Collateralized Reinsurance, Catastrophe Bonds, Industry
Loss Warranties (ILW), Sidecars, and ILS Fund Structures.
For more than 230 years, we have been a strong stable company with
excellent long-term credit ratings. BNY Mellon is the right choice for you.
For more information, please contact
Robert Thorson at 212-815-7149
bnymellon.com/corporatetrust
© 2015 The Bank of New York Mellon Corporation. All rights reserved. BNY Mellon is the corporate brand for The Bank of New York Mellon
Corporation. Products and services referred to herein are provided by The Bank of New York Mellon Corporation and its subsidiaries. Content
is provided for informational purposes only and is not intended to provide authoritative ï¬nancial, legal, regulatory or other professional advice.
For more disclosures, see https://www.bnymellon.com/us/en/disclaimers/business-disclaimers.jsp#corporatetrust
�
18) All catastrophe bond and ILS issuance data sourced
from the Artemis Deal Directory.
Opportunities exist to work with Artemis to increase your
profile to this segment of the global reinsurance and risk
transfer market. Advertising opportunities, sponsorship,
content development and partnership opportunities are
available. Contact us to discuss.
CONTACT ARTEMIS:
Steve Evans, Owner/Editor
steve@artemis.bm
+44 (0) 7711 244697
To download a media pack visit:
www.artemis.bm/advertise/
Copyright 2014 Artemis.bm, owned by Steve Evans Ltd.
�