

1) MINISTRY OF INDUSTRY, INVESTMENT AND COMMERCE Industrial Performance Report Trend Analysis – 2000 and Beyond Prepared by Policy Planning Projects & Research Division November 2011
2) Industrial Performance Report Contents Summary Points – Trend Analysis of Industrial Performance Indicators....................................................................................................................... 2 Summary Points – Quarterly Review of Selected Industrial Performance Indicators ................................................................................................... 4 Summary Table of Selected Indicators ........................................................................................................................................................................... 6 Industrial Performance Indicators ................................................................................................................................................................................. 7 1.Stock of Outstanding Commercial Banks Loans and Advances to Businesses........................................................................................................ 7 Number of Commercial Banks Loans and Advances Accounts ................................................................................................................................. 9 2. Foreign Direct Investments .................................................................................................................................................................................. 11 3. Gross Fixed Capital Formation ............................................................................................................................................................................. 13 4. Number of New Businesses Registered ............................................................................................................................................................... 14 5. Employed Labour Force ....................................................................................................................................................................................... 15 6. Number of Jobs Advertised in the Print Media.................................................................................................................................................... 17 7. Labour Productivity .............................................................................................................................................................................................. 21 8. Goods Exports ...................................................................................................................................................................................................... 22 9. Local Cement Sales............................................................................................................................................................................................... 24 10. Electricity Sales to Industry ................................................................................................................................................................................ 25 Explanatory Notes ........................................................................................................................................................................................................ 26 1 November 2011
3) Industrial Performance Report Summary Points – Trend Analysis of Industrial Performance Indicators Commercial Bank Loans and Advances to Businesses – Stock and Number of Accounts The stock of outstanding credit to businesses held by commercial banks has increased considerably, particularly from 2000 to mid-2009, at which point, it peaked at a value of J$132.98 billion (in July 2009) and has since reflected a downward trend. Growth in the stock of outstanding credit to businesses was strong during the recessionary periods of 2008 up to 2009. However, by late 2009 to August 2011, commercial bank credit to businesses displayed fluctuating month-to-month changes, with oscillating patterns of increases and decreases between August 2009 and July 2010, followed by six consecutive months of decline between August 2010 and January 2011 and continued fluctuations thereafter. Overall, the number of loans and advances accounts for businesses held by commercial banks has declined considerably since early 2001, relative to 2000 (see Fig. 1.4). There were significant declines during late 2002 to early 2003, however, credit to businesses started to rebound throughout late 2003 (see Fig.1.5). Consecutive declines occurred between January and June 2004, but the number of accounts generally displayed fluctuating patterns up to October 2005 and again recorded successive periods of decline between December 2005 and May 2006. Significant increase was recorded in June 2006, and this was followed by declines up to October 2006. Sharpe increases could also be seen between November 2006 and January 2007, but this was followed by declines over subsequent months in the first half of the year and increases during late 2007. Signs of upward trend in the number of accounts could be seen for most of 2008, although declines were recorded for August, September and for three consecutive months - November and December 2008 to January 2009. The number of accounts for the remainder of 2009 generally remained flat, although decreases were recorded for April, June, October and December of that year. The number of accounts recorded throughout the months of 2010 and 2011 fell below the monthly number of accounts recorded in 2009. Declines could be seen for February, March, May, June, August, September, November and December 2010. Between January and August 2011, the only months which recorded an increase were March and August which explain the worsening of the downtrend in the number of business accounts in 2011. Foreign Direct Investment The stock of foreign direct investments has increased significantly between 2000 and 2010. Between 2000 and 2010, FDI stock increased as a result of average FDI inflows of US$682.5 million per annum. At the end of 2010, this stock was estimated at US$10.9 billion, an increase of US$227.7 million when compared to the end of 2009. In 2008, Jamaica attracted US$1.4 billion in FDI flows, the highest amount in any given year. Investment performance in 2008 is largely due to the purchase of approximately 49% shareholding in the Lascelles de Mercado Company by a Trinidad & Tobago spirits company. However, consequent to the global economic downturn, FDI flows subsequently plunged in 2009 and 2010, with declines of -62.35% and -57.91% respectively. 2 November 2011
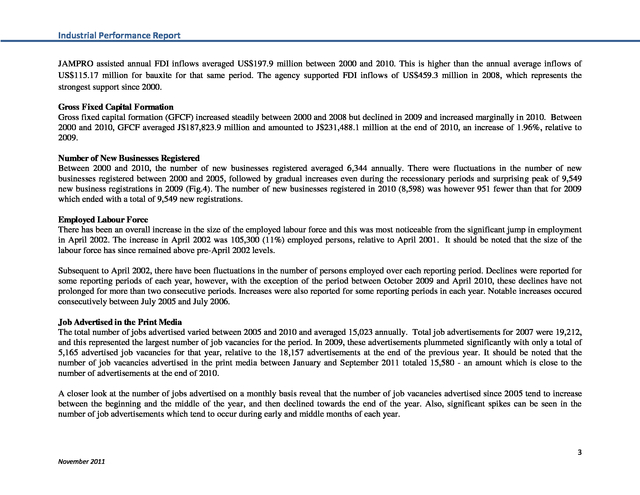
4) Industrial Performance Report JAMPRO assisted annual FDI inflows averaged US$197.9 million between 2000 and 2010. This is higher than the annual average inflows of US$115.17 million for bauxite for that same period. The agency supported FDI inflows of US$459.3 million in 2008, which represents the strongest support since 2000. Gross Fixed Capital Formation Gross fixed capital formation (GFCF) increased steadily between 2000 and 2008 but declined in 2009 and increased marginally in 2010. Between 2000 and 2010, GFCF averaged J$187,823.9 million and amounted to J$231,488.1 million at the end of 2010, an increase of 1.96%, relative to 2009. Number of New Businesses Registered Between 2000 and 2010, the number of new businesses registered averaged 6,344 annually. There were fluctuations in the number of new businesses registered between 2000 and 2005, followed by gradual increases even during the recessionary periods and surprising peak of 9,549 new business registrations in 2009 (Fig.4). The number of new businesses registered in 2010 (8,598) was however 951 fewer than that for 2009 which ended with a total of 9,549 new registrations. Employed Labour Force There has been an overall increase in the size of the employed labour force and this was most noticeable from the significant jump in employment in April 2002. The increase in April 2002 was 105,300 (11%) employed persons, relative to April 2001. It should be noted that the size of the labour force has since remained above pre-April 2002 levels. Subsequent to April 2002, there have been fluctuations in the number of persons employed over each reporting period. Declines were reported for some reporting periods of each year, however, with the exception of the period between October 2009 and April 2010, these declines have not prolonged for more than two consecutive periods. Increases were also reported for some reporting periods in each year. Notable increases occured consecutively between July 2005 and July 2006. Job Advertised in the Print Media The total number of jobs advertised varied between 2005 and 2010 and averaged 15,023 annually. Total job advertisements for 2007 were 19,212, and this represented the largest number of job vacancies for the period. In 2009, these advertisements plummeted significantly with only a total of 5,165 advertised job vacancies for that year, relative to the 18,157 advertisements at the end of the previous year. It should be noted that the number of job vacancies advertised in the print media between January and September 2011 totaled 15,580 - an amount which is close to the number of advertisements at the end of 2010. A closer look at the number of jobs advertised on a monthly basis reveal that the number of job vacancies advertised since 2005 tend to increase between the beginning and the middle of the year, and then declined towards the end of the year. Also, significant spikes can be seen in the number of job advertisements which tend to occur during early and middle months of each year. 3 November 2011
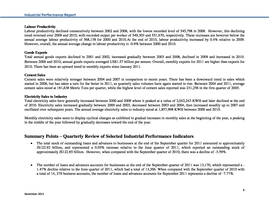
5) Industrial Performance Report Labour Productivity Labour productivity declined consecutively between 2002 and 2008, with the lowest recorded level of 545,798 in 2008. However, this declining trend reversed over 2009 and 2010, with recorded output per worker of 549,303 and 551,670, respectively. These increases are however below the annual average labour productivity of 568,138 for 2000 and 2010.At the end of 2010, labour productivity increased by 0.4% relative to 2009. However, overall, the annual average change in labour productivity is -0.9% between 2000 and 2010. Goods Exports Total annual goods exports declined in 2001 and 2002, increased gradually between 2003 and 2008, declined in 2009 and increased in 2010. Between 2000 and 2010, annual goods exports averaged US$1.57 billion per annum. Overall, monthly exports for 2011 are higher than exports for 2010. There has been an upward trend in monthly exports since January 2011. Cement Sales Cement sales were relatively stronger between 2004 and 2007 in comparison to recent years. There has been a downward trend in sales which started in 2008, but has taken a turn for the better in 2011, as quarterly sales volumes have again started to rise. Between 2004 and 2011, average cement sales stood at 181,638 Metric Tons per quarter, while the highest level of cement sales reported was 231,256 in the first quarter of 2005. Electricity Sales to Industry Total electricity sales have generally increased between 2000 and 2009 where it peaked at a value of 2,042,243 KWH and later declined at the end of 2010. Electricity sales increased gradually between 2000 and 2003, decreased between 2003 and 2004, then increased steadily up to 2007 and oscillated over subsequent years. The annual average electricity sales to industry stood at 1,857,998 KWH between 2000 and 2010. Monthly electricity sales seem to display cyclical changes as exhibited in gradual increases in monthly sales at the beginning of the year, a peaking in the middle of the year followed by gradually decreases toward the end of the year. Summary Points – Quarterly Review of Selected Industrial Performance Indicators ï‚· The total stock of outstanding loans and advances to businesses at the end of the September quarter for 2011 amounted to approximately J$122.92 billion, and represented a 0.05% increase relative to the June quarter of 2011, which reported an outstanding stock of approximately J$122.85 billion. However, when compared with the September quarter of 2010, there was a decline of -3.59%. ï‚· The number of loans and advances accounts for businesses at the end of the September quarter of 2011 was 13,170, which represented a 1.47% decline relative to the June quarter of 2011, which had a total of 13,366. When compared with the September quarter of 2010 with a total of 14, 279 business accounts, the number of loans and advances accounts for September 2011 represents a decline of -7.77%. 4 November 2011
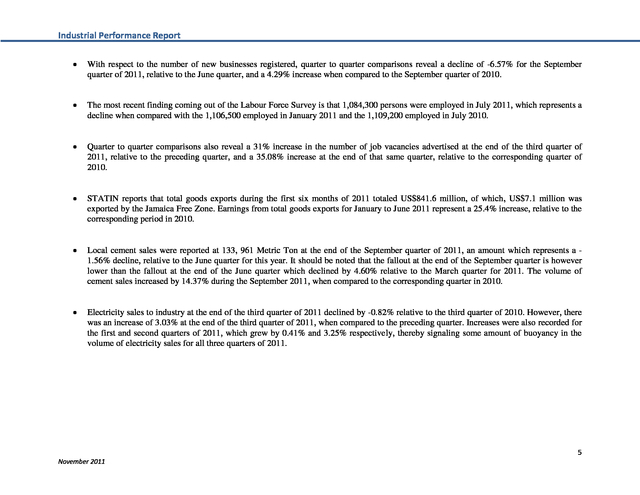
6) Industrial Performance Report ï‚· With respect to the number of new businesses registered, quarter to quarter comparisons reveal a decline of -6.57% for the September quarter of 2011, relative to the June quarter, and a 4.29% increase when compared to the September quarter of 2010. ï‚· The most recent finding coming out of the Labour Force Survey is that 1,084,300 persons were employed in July 2011, which represents a decline when compared with the 1,106,500 employed in January 2011 and the 1,109,200 employed in July 2010. ï‚· Quarter to quarter comparisons also reveal a 31% increase in the number of job vacancies advertised at the end of the third quarter of 2011, relative to the preceding quarter, and a 35.08% increase at the end of that same quarter, relative to the corresponding quarter of 2010. ï‚· STATIN reports that total goods exports during the first six months of 2011 totaled US$841.6 million, of which, US$7.1 million was exported by the Jamaica Free Zone. Earnings from total goods exports for January to June 2011 represent a 25.4% increase, relative to the corresponding period in 2010. ï‚· Local cement sales were reported at 133, 961 Metric Ton at the end of the September quarter of 2011, an amount which represents a 1.56% decline, relative to the June quarter for this year. It should be noted that the fallout at the end of the September quarter is however lower than the fallout at the end of the June quarter which declined by 4.60% relative to the March quarter for 2011. The volume of cement sales increased by 14.37% during the September 2011, when compared to the corresponding quarter in 2010. ï‚· Electricity sales to industry at the end of the third quarter of 2011 declined by -0.82% relative to the third quarter of 2010. However, there was an increase of 3.03% at the end of the third quarter of 2011, when compared to the preceding quarter. Increases were also recorded for the first and second quarters of 2011, which grew by 0.41% and 3.25% respectively, thereby signaling some amount of buoyancy in the volume of electricity sales for all three quarters of 2011. 5 November 2011
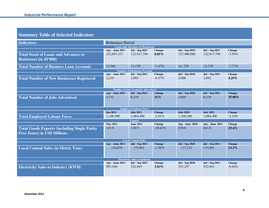
7) Industrial Performance Report Summary Table of Selected Indicators Indicators Reference Period Loans and Advances to Businesses Apr – June 2011 Jul – Sep 2011 Change Jul – Sep 2010 Jul – Sep 2011 Change Total Stock of Loans and Advances to Businesses (in J$’000) 122,853,327 122,917,796 0.05% 127,488,980 122,917,796 -3.59% Total Number of Business Loan Accounts 13,366 13,170 -1.47% -7.77% Jul – Sep 2010 Jul – Sep 2011 Change 2,239 2,006 2,092 4.29% Jul – Sep 2010 Jul – Sep 2011 Change 4,732 31% 4,604 6,219 35.08% Change July 2010 July 2011 Change -2.01% 1,109,200 1,084,300 -2.24% Change Jan – June 2010 Jan – June 2011 Change -10.42% 670.6 841.6 25.4% Change Jul – Sep 2010 Jul – Sep 2011 Change -1.56% 117,131 133,961 14.3% Electricity Sales to Industry Apr – June 2011 Jul – Sep 2011 Total Number of Jobs Advertised 13,170 Number of Job Vacancies Advertised Apr – June 2011 Jul – Sep 2011 Change Total Number of New Businesses Registered 14, 279 Number of Businesses Formed Apr – June 2011 Jul – Sep 2011 Change Change Jul – Sep 2010 Jul – Sep 2011 Change 507,540 3.03% 527,257 522,943 -0.82% Jan 2011 Total Employed Labour Force 2,092 6,219 Employed Labour Force July 2011 1,106,500 May 2011 Total Goods Exports (including Single Entity Free Zones) in US$ Millions 143.9 1,084,300 Exports June 2011 128.9 Local Cement Sales Apr – June 2011 Jul – Sep 2011 Local Cement Sales (in Metric Tons) Electricity Sales to Industry (KWH) 136,078 133,961 522,943 -6.57% 6 November 2011
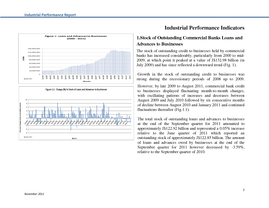
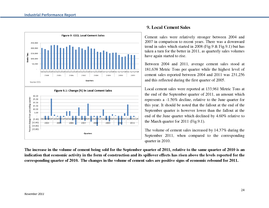
8) Industrial Performance Report Industrial Performance Indicators 1.Stock of Outstanding Commercial Banks Loans and Advances to Businesses The stock of outstanding credit to businesses held by commercial banks has increased considerably, particularly from 2000 to mid2009, at which point it peaked at a value of J$132.98 billion (in July 2009) and has since reflected a downward trend (Fig. 1). Growth in the stock of outstanding credit to businesses was strong during the recessionary periods of 2008 up to 2009. Source: BOJ Figure 1.1: Change (%) in Stock of Loans and Advances to Businesses 8 6 4 2 0 Jan M 00 ay -0 Se 0 p0 Jan 0 M 01 ay -0 Se 1 p0 Jan 1 M 02 ay -0 Se 2 p0 Jan 2 M 03 ay -0 Se 3 p0 Jan 3 M 04 ay -0 Se 4 p0 Jan 4 M 05 ay -0 Se 5 p0 Jan 5 M 06 ay -0 Se 6 p0 Jan 6 M 07 ay -0 Se 7 p0 Jan 7 M 08 ay -0 Se 8 p0 Jan 8 M 09 ay -0 Se 9 p0 Jan 9 M 10 ay -1 Se 0 p1 Jan 0 M 11 ay -1 1 Percent change from preceding month 10 However, by late 2009 to August 2011, commercial bank credit to businesses displayed fluctuating month-to-month changes, with oscillating patterns of increases and decreases between August 2009 and July 2010 followed by six consecutive months of decline between August 2010 and January 2011 and continued fluctuations thereafter (Fig.1.1). -2 -4 -6 -8 Source: BOJ Months The total stock of outstanding loans and advances to businesses at the end of the September quarter for 2011 amounted to approximately J$122.92 billion and represented a 0.05% increase relative to the June quarter of 2011 which reported an outstanding stock of approximately J$122.85 billion. The amount of loans and advances owed by businesses at the end of the September quarter for 2011 however decreased by -3.59%, relative to the September quarter of 2010. 7 November 2011
9) Industrial Performance Report Four sectors reflected outstanding stock of loans and advances which are above the monthly average amount outstanding for all businesses, between January 2000 and August 2011 (Fig. 1.2). These sectors are tourism, construction & land development, professional & other services, and distribution. The tourism sector accounts for the largest stock of loans and advances from commercial banks over the period, followed by the distribution sector which has maintained the second highest stock of outstanding loans and advances, particularly since early 2005. Construction & land development and professional & other services have generally alternated in terms of where they fall in the place for third of fourth highest levels, however construction & land development have maintained the third highest level of the stock of loans and advances since mid2010. Sectors with outstanding stock of loans and advances that generally fell below the average per month, particularly since 2005 are mining, electricity, gas & water, agriculture, transport, storage & communication and manufacturing. The manufacturing, transport, storage & communication sectors have accumulated stock of loans and advances that fell below the average per month, in previous years (Fig. 1.3). 8 November 2011
10) Industrial Performance Report Number of Commercial Banks Loans and Advances Accounts Figure 1.4: Number of Loans and Advances Accounts for Businesses Overall, the number of loans and advances accounts for businesses held by commercial banks has declined considerably since early 2001, relative to 2000 (see Fig. 1.4). 25000 Number of Accounts for Businesses 20000 15000 10000 5000 Apr-11 Jun-10 Nov-10 Jan-10 Aug-09 Oct-08 Mar-09 May-08 Jul-07 Dec-07 Feb-07 Sep-06 Apr-06 Jun-05 Nov-05 Jan-05 Aug-04 Oct-03 Mar-04 May-03 Jul-02 Dec-02 Feb-02 Sep-01 Apr-01 Jun-00 Nov-00 Jan-00 0 Months Figure 1.5: Change (%) in Number of Loans and Advances Accounts for Businesses There were significant declines during late 2002 to early 2003 however credit to businesses started to rebound throughout late 2003 (see Fig.1.5). Consecutive declines occurred between January and June 2004 but the number of accounts generally displayed fluctuating patterns up to October 2005 and again recorded successive periods of decline between December 2005 and May 2006. 15 5 0 Ja n0 M 0 ay -0 0 Se p0 Ja 0 n0 M 1 ay -0 1 Se p0 Ja 1 n0 M 2 ay -0 2 Se p02 Ja n0 M 3 ay -0 3 Se p0 Ja 3 n0 M 4 ay -0 4 Se p0 Ja 4 n0 M 5 ay -0 5 Se p0 Ja 5 n0 M 6 ay -0 Se 6 p0 Ja 6 n0 M 7 ay -0 7 Se p0 Ja 7 n0 M 8 ay -0 8 Se p0 Ja 8 n0 M 9 ay -0 9 Se p09 Ja n1 M 0 ay -1 0 Se p1 Ja 0 n1 M 1 ay -1 1 Percent Change from Preceding Month 10 -5 -10 -15 -20 Significant increase was recorded in June 2006 and this was followed by declines up to October 2006. Sharpe increases could also be seen between November 2006 and January 2007 but this was followed by declines over subsequent months in the first half of the year and increases during late 2007. Months Signs of upward trend in the number of accounts could be seen for most of 2008, although declines were recorded for August, September and for three consecutive months --- November and December 2008 to January 2009. The number of accounts for the remainder of 2009 generally remained flat, although decreases were recorded for April, June, October and December of that year. The number of accounts recorded throughout the months of 2010 and 2011 fell below the monthly number of accounts recorded in 2009. Declines could be seen for February, March, May, June, August, September, November and December 2010. Between January and August 2011, the only months which recorded an increase were March and August which explain the worsening of the downtrend in the number of business accounts in 2011. 9 November 2011
11) Industrial Performance Report The number of loans and advances accounts for businesses at the end of the September quarter of 2011 was 13,170 which represented a -1.47% decline relative to the June quarter of 2011 which had a total of 13,366. When compared with the September quarter of 2010 with a total of 14,279 business accounts, the number of loans and advances accounts for September 2011 represents a decline of -7.77%. Source: BOJ The declining trend in the stock of outstanding loans as well as the number of businesses that have been borrowing over the last two years, indicate that businesses have been cutting back on their demand for credit. This could reflect dwindling confidence about the prospects for the economy or that businesses have been using other means of financing their operations. Nonetheless, if business loans remain tepid, this could further slow the rate of economic recovery. 10 November 2011
12) Industrial Performance Report 2. Foreign Direct Investments The stock of foreign direct investments has increased significantly between 2000 and 2010 (Fig. 2). Between 2000 and 2010, FDI stock increased as a result of average FDI inflows of US$682.5 million per annum. At the end of 2010, this stock was estimated at US$10.9 billion, an increase of US$227.7 million when compared to end-2009 (Fig. 2.1). Source: UNCTAD Source: UNCTAD Source: JAMPRO Notably, in 2008, Jamaica attracted US$1.4 billion in FDI flows, the highest amount in any given year. Investment performance in 2008 is largely due to the purchase of approximately 49% shareholding in the Lascelles de Mercado Company by a Trinidad & Tobago spirits company. However, consequent to the global economic downturn, FDI flows subsequently plunged in 2009 and 2010, with declines of 62.35% and -57.91% respectively (Fig. 2.2). The ICT, tourism and mining industries have generally accounted for most of the FDI inflows since 2000. Other sectors/industries such as agriculture, manufacturing, distribution, minerals & chemicals and insurance have also attracted these inflows (Fig. 2.3). Significant increases in FDI flows in 2008 were also attributed to inflows in the agricultural/manufacturing/distribution and ICT sectors which increased by 61% and 56.2% respectively, relative to 2007. All sectors with the exception of minerals & chemicals (which moved from zero inflows in 2009 to inflows totaling US$0.6 million in 2010) recorded a decline of as much as -55.43% at the end of 2010, when compared to the corresponding year. 11 November 2011
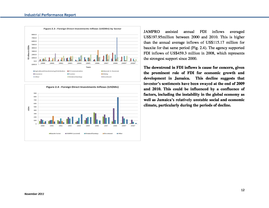
13) Industrial Performance Report JAMPRO assisted annual FDI inflows averaged US$197.95million between 2000 and 2010. This is higher than the annual average inflows of US$115.17 million for bauxite for that same period (Fig. 2.4). The agency supported FDI inflows of US$459.3 million in 2008, which represents the strongest support since 2000. The downtrend in FDI inflows is cause for concern, given the prominent role of FDI for economic growth and development in Jamaica. This decline suggests that investor’s sentiments have been swayed at the end of 2009 and 2010. This could be influenced by a confluence of factors, including the instability in the global economy as well as Jamaica’s relatively unstable social and economic climate, particularly during the periods of decline. 12 November 2011
14) Industrial Performance Report 3. Gross Fixed Capital Formation Gross fixed capital formation (GFCF) increased steadily between 2000 and 2008 but declined in 2009 and increased marginally in 2010 (Fig. 3& 3.1). Between 2000 and 2010, GFCF averaged J$187,823.9 million and amounted to J$231,488.1 million at the end of 2010, an increase of J$4,456.4 million or 1.96%, relative to 2009. Between 2009 and 2010, there was an increase in the value of expenditure on construction specifically buildings and other structures which increased from J$95,940.8 million and J$19,039.2 million to J$101,017.4 million and J$23,934.4 million respectively. Increases in the categories of construction capital items such as buildings and other structures follows from the steady upward trend in investments in these areas since 2001 (Fig.3.2). The value of expenditure on transport equipment also increased from J$15,536.9 million in 2009 to J$18,571.8 million in 2010. Other goods and tangible fixed capital also increased marginally from J$5,604.0 million in 2009 to J$5,636.2 million in 2010. The value of other machinery and equipment however declined in 2010 at a value of J$82,328.2 million, down from J$90,910.8 million in 2009 (Fig. 3.2). Higher acquisition of capital items in 2010, relative to 2009 reflects investor optimism about the future of the economy at the end of 2010. 13 November 2011
15) Industrial Performance Report Number of Businesses Registered Figure 4: Number of Businesses Registered 4. Number of New Businesses Registered 12000 10000 8843 8000 9549 8598 7104 6000 5210 4912 2001 2002 4202 5349 5389 2003 2004 5849 4779 4000 2000 0 2000 2005 Years 2006 2007 2008 2009 2010 Figure 4.1: Monthly Number of Businesses Registered Number of Businesses Registered 1200 1000 800 600 400 200 Jan. Feb Mar Apr May Jun July Aug Sept Oct Nov Dec Jan. Feb Mar Apr May Jun July Aug Sept Oct Nov Dec Jan. Feb Mar Apr May Jun July Aug Sept Oct Nov Dec Jan. Feb Mar Apr May Jun July Aug Sept Oct Nov Dec Jan. Feb Mar Apr May Jun July Aug Sept Oct Nov Dec Jan. Feb Mar Apr May Jun July Aug Sept Oct Nov Dec Jan. Feb Mar Apr May Jun July Aug Sept Oct Nov Dec 0 2005 2006 2007 2008 Months 2009 2010 2011 Between 2000 and 2010, the number of new businesses registered averaged 6,344 annually. There were fluctuations in the number of new businesses registered between 2000 and 2005, followed by gradual increases even during the recessionary periods and surprising peak of 9,549 new business registrations in 2009 (Fig.4). The number of new businesses registered in 2010 (8,598) was however 951 fewer than that for 2009 which ended with a total of 9,549 new registrations. Monthly figures for new business registration between 2005 and 2011 also reveal a similar uptrend since 2006. The decline in the number of new businesses registered at the end of 2010 was reflected in the decreases in monthly registration for the months of February, April, May, July, August, September and December of that year (Fig. 4.1& 4.2). At the end of September 2011, the total number of new businesses registered since the start of the year stood at 6,874, an increase of 219 (3.29%) new registration when compared with January to September 2010 with 6,655 new registrations. Quarter to quarter comparisons reveal a decline of 6.57% for the September quarter of 2011 relative to the June quarter and a 4.29% increase when compared to the September quarter of 2010. 14 November 2011
16) Industrial Performance Report 5. Employed Labour Force There has been an overall increase in the size of the employed labour force and this was most noticeable from the significant jump in employment in April 2002. The increase in April 2002 was 105,300 (11%) employed persons, relative to April 2001 (Fig. 5). It should be noted that the size of the labour force has since remained above pre-April 2002 levels. Figure 5: Total Employed Labour Force 1,400,000 Total Number 1,200,000 1,000,000 800,000 600,000 400,000 200,000 2000 2002 2003 2004 2005 2006 2007 2008 2009 July July 2010 January October April January July October April July January October April January July October April July January October April January July October April July January October April July October April April April 2001 October January July October Source: STATIN April January 0 2011 Figure 5.1 Change (%) in Employed Labour Force 11 10 8 6 0 3 2 2 1 1 1 3 2 1 2 1 2 2 January 3 2 2 October 4 1 0 1 1 2002 2003 2004 2005 2010 July -2 October -2 -2 January July 0 October -1 January July 2009 1 April October -2 2008 October -3 July 1 2007 April July -1 -1 2006 April January October July April January July -1 October April -1 January July -2 October April July October April October April 1 -2 2001 April 2000 April 1 January October -1 January -4 July -2 April 0 January Percent change from preceding period 12 2011 The most recent finding coming out of the Labour Force Survey is that 1,084,300 persons were employed in July 2011, which represents a decline when compared with the 1,106,500 employed in January 2011 and the 1,109,200 employed in July 2010. Source: STATIN Figure 5.2: Sectors with'Above Average' Number of Employees 250,000 200,000 150,000 100,000 50,000 2004 2005 Agri cul ture, Hunti ng, Fores try & Fi s hi ng Cons tructi on a nd Ins ta l l a ti on Hotel s & Res ta ura nts Servi ces Avera ge 2006 2007 2008 2009 2010 July January October July April January October July April January October July April January October July April January October July April January October July April January October July 0 April Number of Employees Subsequent to April 2002, there have been fluctuations in the number of persons employed over each reporting period. Declines were reported for some reporting periods of each year, however with the exception of the period between October 2009 and April 2010, these declines have not prolonged for more than two consecutive periods. Increases were also reported for some reporting periods in each year. Notable increases occured consecutively between July 2005 and July 2006. 2011 Ma nufa cturi ng Whol es a l e & Reta i l , Repa i r of Motor Vehi cl e, Cycl e, Pers ona l & Hous ehol d Goods Tra ns port, Stora ge a nd Communi ca ti on Sectors which employed more than the average number of employees over each reporting period are agriculture, hunting, forestry & fishing, construction & installation, hotels & restaurants services, manufacturing, wholesale & retail, repair of motor vehicle, cycle, personal and 15 November 2011
17) Industrial Performance Report 2005 Pri va te Hous ehol ds wi th Empl oyed Pers ons Mi ni ng & Qua rryi ng Rea l Es ta te, Renti ng & Bus i nes s Acti vi ti es Educa ti on Other Communi ty, Soci a l a nd Pers ona l Servi ce Acti vi ti es Avera ge 2009 El ectri ci ty, Ga s a nd Wa ter Suppl y Fi na nci a l Intermedi a ti on Publ i c Admi ni s tra ti on & Defence; Compul s ory Soci a l Securi ty Hea l th & Soci a l Work Indus try Not Speci fi ed (Incl . Extra -Terri tori a l Bodi es ) July January July 2010 October April January July October April January July 2008 October April January July 2007 October April January July 2006 October April January July October April January July 2004 October 80000 70000 60000 50000 40000 30000 20000 10000 0 April Number of Employees Figure 5.3: Sectors with 'Below Average' Number of Employees 2011 household goods and transport storage & communication (Fig. 5.2). All other sectors generally employed less than the average number of employees for each reporting period (Fig. 5.3), although the education sector had above average employment in October 2010, January 2011 and July 2011. Other sectors have also had above average employment over past reporting periods, these include: private households with employed persons and real estate, renting & business activities. At the end of July 2011, it was reported that employment in real estate, renting & business activities and hotels & restaurants services increased by 20.0 % and 10.9 % respectively, relative to the corresponding period in 2010. Declines were however reported for agriculture, hunting, forestry & fishing and wholesale & retail, repair of motor vehicles & equipment which declined by 14.0% and 7.8%, respectively. 16 November 2011
18) Industrial Performance Report 6. Number of Jobs Advertised in the Print Media Number of Jobs Advertised Figure 6: Total Number of Jobs Advertised 25,000 20,000 19,212 16,067 18,157 15,954 15,585 15,000 10,000 5,165 5,000 0 2005 2006 2007 Source: MLSS 2008 2009 2010 Years Figure 6.1 : Number of Jobs Advertised in Print Media 3,000 Number of Jobs Advertised The total number of jobs advertised varied between 2005 and 2010 and averaged 15,023 annually (Fig. 6). Total job advertisements for 2007 were 19,212 and this represented the largest number of job vacancies for the period. In 2009, these advertisements plummeted significantly with only a total of 5,165 advertised job vacancies for that year, relative to the 18,157 advertisements at the end of the previous year. 2,500 2,000 1,500 It should be noted that the number of job vacancies advertised in the print media between January and September 2011 totaled 15,580---an amount which is close to the number of advertisements at the end of 2010. This amount also represents a 31.45% increase in the number of jobs advertised between January and September 2011 which amounted to 11,852 job advertisements. The number of job advertisements also increased by 27% in September 2011, relative to August 2011. 1,000 500 Jan Feb March April May June July Augus Sept Oct Nov Dec Jan Feb March April May June July Augus Sept Oct Nov Dec Jan Feb March April May June July Augus Sept Oct Nov Dec Jan Feb March April May June July Augus Sept Oct Nov Dec Jan Feb March April May June July Augus Sept Oct Nov Dec Jan Feb March April May June July Augus Sept Oct Nov Dec Jan Feb March April May June July Augus Sept 0 2005 2006 2007 2008 2009 2010 2011 Months 200 150 100 50 0 -50 -100 Jan Feb March April May June July Augus Sept Oct Nov Dec Jan Feb March April May June July Augus Sept Oct Nov Dec Jan Feb March April May June July Augus Sept Oct Nov Dec Jan Feb March April May June July Augus Sept Oct Nov Dec Jan Feb March April May June July Augus Sept Oct Nov Dec Jan Feb March April May June July Augus Sept Oct Nov Dec Jan Feb March April May June July Augus Sept Percent change from preceding month Figure 6.2: Change (%) in Number of Job Advertised in print Media 2005 2006 2007 2008 Months 2009 2010 2011 Quarter to quarter comparisons also reveal a 31% increase in the number of job vacancies advertised at the end of the third quarter of 2011, relative to the preceding quarter and a 35.08% increase at the end of that same quarter relative to the corresponding quarter of 2010. A closer look at the number of jobs advertised on a monthly basis reveal that the number of job vacancies advertised since 2005 tend to increase between the beginning and the middle of the year and then declined towards the end of the year (Fig. 6.1 & Fig. 6.2). Also, significant spikes can be seen in the number of job advertisements which tend to occur during early and middle months of each year (Fig. 6.1). 17 November 2011
19) Industrial Performance Report A sectoral breakdown of job advertisements between 2010 and 2011 is provided in tables 2 and 3. Figure 6.3 provides a snapshot of the changes in the total of job advertisements by sector, over three different time periods. It shows that the level of demand for labour in manufacture, wholesale & retail, transport, storage & communication, real estate, renting & business services and other community, social and personal services, for January to September 2011 is much higher than the demand for January to September 2010 as well as the total for 2010-end. Sectors such as hotel & restaurant, private household, health and social work, education and ‘sector not specified’ have shown an increase in the number of jobs advertised for January to September 2011, relative to the same period in 2010. A decline in the size of the employed labour force is particularly worrying given the fragile state of the economy. However, all things equal there is a possibility that the reported decline for July 2011 could reverse over the coming months based on the relatively strong demand for labour up to the end of September 2011. 18 November 2011
20) Industrial Performance Report Table 2: The Number of Jobs Advertised by Economic Sector via the Print Media January 1 to December 31, 2010 Economic Sectors Jan Feb March April May June July August Sept Oct Nov Dec Total Agriculture, Forestry & Fishing 14 11 6 3 16 9 5 5 4 2 6 11 92 Mining & Quarrying 7 21 5 2 22 5 5 10 4 9 2 0 92 Manufacture 42 87 61 71 76 76 78 100 108 133 122 104 1,058 Electricity, Gas & Water 3 8 5 7 11 16 25 7 34 12 7 3 138 Construction & Installation 0 6 23 12 22 22 10 23 10 13 17 28 186 Wholesale & Retail, Hotel and Restaurant Services 68 87 77 40 67 130 193 157 286 251 142 179 1,677 Hotels and Restaurants 3 134 84 62 98 55 93 85 180 99 102 132 1,127 Transport, Storage & Communication 51 77 63 50 54 44 69 55 72 80 30 55 700 Finance & Insurance, Real Estate and Business Servs. 128 82 42 69 70 51 38 72 53 39 39 33 716 Real Estate, Renting & Business Services 2 32 16 33 29 22 33 32 27 34 7 9 276 Public Administration & Defence 0 73 34 97 81 66 51 45 48 55 60 139 749 Education 56 108 119 137 173 421 407 247 132 67 127 134 2,128 Health and Social Work 2 39 14 16 36 23 28 29 32 21 26 19 285 32 55 56 81 76 98 151 164 249 107 1,249 0 0 2 2 0 0 28 56 39 30 39 24 220 Sector Not Identified 526 406 350 776 430 465 307 506 363 290 256 217 4,892 Total 909 1,203 956 1,433 1,266 1,481 1,468 1,580 1,556 1,308 1,231 1,194 15,585 Average among sectors per month 57 75 60 90 79 93 92 99 97 82 77 75 Other Community, Social and Personal Services Private Household 7 173 Source: Gleaner and Observer Newspapers/Ministry of Labour and Social Security 19 November 2011
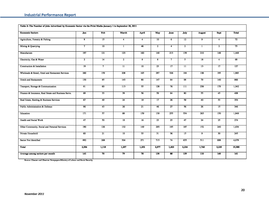
21) Industrial Performance Report Table 3: The Number of Jobs Advertised by Economic Sector via the Print Media January 1 to September 30, 2011 Economic Sectors Jan Feb March April May June July August Sept Total Agriculture, Forestry & Fishing 8 15 4 4 10 6 12 9 4 72 Mining & Quarrying 7 10 1 46 2 4 2 1 2 75 187 121 123 160 149 213 138 210 148 1,449 Electricity, Gas & Water 2 14 2 8 8 7 5 18 4 68 Construction & Installation 18 7 11 10 23 17 11 13 17 127 Wholesale & Retail, Hotel and Restaurant Services 260 159 208 165 287 326 184 109 185 1,883 Hotels and Restaurants 130 85 143 80 147 64 98 79 140 966 Transport, Storage & Communication 81 60 113 55 128 76 111 239 179 1,042 Finance & Insurance, Real Estate and Business Servs. 68 33 38 56 59 64 80 55 45 498 Real Estate, Renting & Business Services 67 49 24 19 17 26 59 40 53 354 Public Administration & Defence 86 43 26 21 46 27 56 26 15 346 Education 171 57 99 159 139 255 554 265 150 1,849 Health and Social Work 47 50 19 16 23 23 47 24 25 274 Other Community, Social and Personal Services 180 126 132 149 293 185 197 152 240 1,654 Private Household 60 21 10 33 31 36 15 9 30 245 Sector Not Identified 882 268 304 271 715 74 655 511 998 4,678 2,254 1,118 1,257 1,252 2,077 1,403 2,224 1,760 2,235 15,580 141 70 79 78 130 88 139 110 140 141 Manufacture Total Average among sectors per month Source: Gleaner and Observer Newspapers/Ministry of Labour and Social Security 20 November 2011
22) Industrial Performance Report Source: JPC 7. Labour Productivity Labour productivity declined consecutively between 2002 and 2008, with the lowest recorded level of 545,798 in 2008. However, this declining trend reversed over 2009 and 2010, with recorded output per worker of 549,303 and 551,670, respectively (Fig. 7). These increases are however below the annual average labour productivity of 568,138 for 2000 and 2010. Overall, the annual average change in labour productivity is -0.9% between 2000 and 2010 but at the end of 2010, labour productivity increased by 0.4% relative to 2009. The year with the largest year-over-year decline in worker output was 2003 when labour productivity fell to 565,275 from 603,284 in the previous year (Fig. 7.1). 21 November 2011
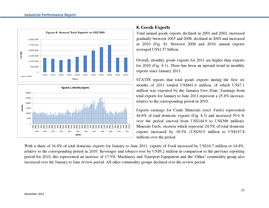
23) Industrial Performance Report 8. Goods Exports Total annual goods exports declined in 2001 and 2002, increased gradually between 2003 and 2008, declined in 2009 and increased in 2010 (Fig. 8). Between 2000 and 2010, annual exports averaged US$1.57 billion. Overall, monthly goods exports for 2011 are higher than exports for 2010 (Fig. 8.1). There has been an upward trend in monthly exports since January 2011. Source: STATIN STATIN reports that total goods exports during the first six months of 2011 totaled US$841.6 million, of which US$7.1 million was exported by the Jamaica Free Zone. Earnings from total exports for January to June 2011 represent a 25.4% increase, relative to the corresponding period in 2010. Exports earnings for Crude Materials (excl. Fuels) represented 44.8% of total domestic exports (Fig. 8.3) and increased 59.6 % over the period (moved from US$144.9 to US$388 million). Minerals Fuels, etcetera which represent 24.5% of total domestic exports increased by 18.5% (US$30.9 million to US$197.8 million) over the period. With a share of 16.4% of total domestic exports for January to June 2011, exports of Food increased by US$16.7 million or 14.4%, relative to the corresponding period in 2010. Beverages and tobacco rose by US$9.2 million in comparison to the previous reporting period for 2010, this represented an increase of 17.3%. Machinery and Transport Equipment and the ‘Other’ commodity group also increased over the January to June review period. All other commodity groups declined over the review period. 22 November 2011
24) Industrial Performance Report Continued improvement in exports over 2010 and 2011 suggest that the demand for exports have shown signs of rebound, although export levels remain below the pre-crisis levels. All things being equal, the relatively higher levels of monthly exports for January to June 2011 could result in an overall increase in exports at the end of 2011 relative to 2010. Source: STATIN 23 November 2011
25) Industrial Performance Report 9. Local Cement Sales Cement sales were relatively stronger between 2004 and 2007 in comparison to recent years. There was a downward trend in sales which started in 2008 (Fig.9 & Fig.9.1) but has taken a turn for the better in 2011, as quarterly sales volumes have again started to rise. Source: CCCL Between 2004 and 2011, average cement sales stood at 181,638 Metric Tons per quarter while the highest level of cement sales reported between 2004 and 2011 was 231,256 and this reflected during the first quarter of 2005. Local cement sales were reported at 133,961 Metric Tons at the end of the September quarter of 2011, an amount which represents a -1.56% decline, relative to the June quarter for this year. It should be noted that the fallout at the end of the September quarter is however lower than the fallout at the end of the June quarter which declined by 4.60% relative to the March quarter for 2011 (Fig.9.1). The volume of cement sales increased by 14.37% during the September 2011, when compared to the corresponding quarter in 2010. The increase in the volume of cement being sold for the September quarter of 2011, relative to the same quarter of 2010 is an indication that economic activity in the form of construction and its spillover effects has risen above the levels reported for the corresponding quarter of 2010. The changes in the volume of cement sales are positive signs of economic rebound for 2011. 24 November 2011
26) Industrial Performance Report 10. Electricity Sales to Industry Total electricity sales have generally increased between 2000 and 2009 where it peaked at a value of 2,042,243 KWH and later declined at the end of 2010. Source: BOJ Electricity sales increased gradually between 2000 and 2003, decreased between 2003 and 2004, then increased steadily up to 2007 and oscillated over subsequent years (Fig. 10). The annual average electricity sales to industry stood at 1,857,998 KWH between 2000 and 2010. Monthly electricity sales seem to display cyclical changes as exhibited in gradual increases in monthly sales at the beginning of the year, a peaking in the middle of the year followed by gradually decreases toward the end of the year. Source: BOJ Electricity sales to industry at the end of the third quarter of 2011 declined by -0.82% relative to the third quarter of 2010. However, there was an increase of 3.03% at the end of the third quarter of 2011, when compared to the preceding quarter. Increases were also recorded for the first and second quarters of 2011, which grew by 0.41% and 3.25% respectively, thereby signaling some amount of buoyancy in the volume of electricity sales for all three quarters of 2011. As a rough proxy for industrial production, the increase in the sales volume of electricity to businesses suggests that business consumption of electricity is on the rise which could positively impact the level of industrial output. Source: BOJ 25 November 2011
27) Industrial Performance Report Explanatory Notes Commercial Banks Loans and Advances to Businesses Credit from commercial banks to businesses was calculated as the difference between total private sector loans and advances and total personal loans and advances. The number of loans and advances accounts was calculated as the difference between total number of private sector loans and advances accounts and total number of personal loans and advances accounts. The amount reported excludes credit to financial institutions. Data Source: Bank of Jamaica Foreign Direct Investments The United Nation Conference on Trade and Development (UNCTAD) defines Foreign Direct Investment (FDI) as an investment involving a long-term relationship and reflecting a lasting interest in and control by a resident entity in one economy (foreign direct investor or parent enterprise) of an enterprise resident in a different economy (FDI enterprise or affiliate enterprise or foreign affiliate). Such investment involves both the initial transaction between the two entities and all subsequent transactions between them and among foreign affiliates. UNCTAD defines FDI stock as the value of the share of their capital and reserves (including retained profits) attributable to the parent enterprise, plus the net indebtedness of affiliates to the parent enterprises. The difference between the stock at the beginning of the year and its value at yearend must be equal to the flow recorded in the Balance of Payments. Data Source: UNCTAD and JAMPRO Gross Fixed Capital Formation The Statistical Institute of Jamaica defines gross fixed capital formation (GFCF) as that part of the current output of goods and services, which adds to the stock of capital, and therefore increases the future potential income flows of the economy. It is measured by the value of acquisitions less disposal of new or existing fixed assets. The following are the main types of gross fixed capital formation: 1. Tangible fixed assets, namely: • dwellings • other buildings and structures • machinery and equipment • cultivated assets such as trees and livestock that are used continuously to produce fruits, milk, etc. 2. Intangible fixed assets, namely: • mineral exploration • computer software • entertainment, literary or artistic originals 3. Major improvements to tangible non-produced assets including land 26 November 2011
28) Industrial Performance Report 4. Costs associated with transfer of ownership of non-produced assets. GFCF could be considered as a general measure of gross net investment in fixed capital during an accounting year. Hence, high levels of GFCF tend to increase productivity and contribute to GDP growth which makes it an important measure of business sentiment as well as a leading indicator for economic growth. When businesses are investing in the big fixed capital items, such as machinery, vehicles, and buildings, it typically reflects optimism for future growth; otherwise, those businesses would other uses for that money. Data Source: STATIN Number of New Businesses Registered This is calculated as the number of business names registered plus number of companies registered. Source: Companies Office of Jamaica Employed Labour Force Data Source: STATIN Number of Jobs Advertised in Print Media The number of jobs advertised is calculated as the number of job advertisements in the Gleaner and the Observer Newspapers. Data Source: Ministry of Labour and Social Security Labour Productivity Data Source: Jamaica Productivity Centre Goods Exports According to STATIN, goods exports are a combination of domestic exports and re-exports. Domestic exports include commodities grown in the island, extracted from its natural resources or manufactured in the country. Re-exports are exports of goods of foreign origin which have not been transformed while in Jamaica. These re-exported goods include goods moving outward from customs storage or manufacturing warehouses. Data Source: STATIN Electricity Sales to Industry Data Source: BOJ 27 November 2011