1) ECONOMIC SITUATION
AND OUTLOOK
June 2016
�
2) PREFACE
This data compilation provides an overview of the most important economic indicators from
1995 onwards. Besides the past development the tables and graphs show the current forecasts
2016 and 2017. This outlook is based on the latest economic outlook of the Austrian Institute
for Economic Research (June 2016).
The next update of this data set is expected for September 2016.
Wirtschaftskammer Österreich
Vienna, June 2016
�
3) CONTENTS
page
Preface
1
Tables and graphs
Economic growth, GDP
2
International growth perspectives
3
Consumption
4
Investment
5
Manufacturing
6
Foreign trade
7
Balance of payments
8
Public finances
9
Interest rates, foreign exchange rates
10
Employment
11
Unemployment
12
Income
13
Inflation
14
�
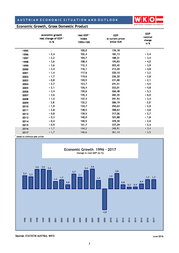
4) AUSTRIAN ECONOMIC SITUATION AND OUTLOOK
Economic Growth, Gross Domestic Product
GDP
economic growth
real change of GDP 1
in %
real GDP 1
index
1995=100
at current prices
billion EUR
nominal
change
in %
.
+ 2,4
+ 2,2
+ 3,6
+ 3,6
+ 3,4
+ 1,4
+ 1,7
+ 0,8
+ 2,7
+ 2,1
+ 3,4
+ 3,6
+ 1,5
- 3,8
+ 1,9
+ 2,8
+ 0,8
+ 0,3
+ 0,4
+ 0,9
+ 1,7
+ 1,7
100,0
102,4
104,7
108,4
112,3
116,1
117,6
119,6
120,5
123,7
126,4
130,6
135,3
137,4
132,2
134,7
138,5
139,5
140,0
140,5
141,7
144,2
146,6
176,18
182,13
188,31
195,83
203,42
213,20
220,10
226,30
231,00
241,51
253,01
266,48
282,35
291,93
286,19
294,63
308,63
317,06
322,88
329,30
337,29
348,91
361,14
.
+ 3,4
+ 3,4
+ 4,0
+ 3,9
+ 4,8
+ 3,2
+ 2,8
+ 2,1
+ 4,5
+ 4,8
+ 5,3
+ 6,0
+ 3,4
- 2,0
+ 2,9
+ 4,8
+ 2,7
+ 1,8
+ 2,0
+ 2,4
+ 3,4
+ 3,5
1995
1996
1997
1998
1999
2000
2001
2002
2003
2004
2005
2006
2007
2008
2009
2010
2011
2012
2013
2014
2015
2016
2017
1
GDP
based on previous year prices
Economic Growth 1996 - 2017
change in real GDP (in %)
3,4
3,6
3,4
1,7
1,9
1,5
1,7
0,8
0,8
1,7
2017
2,1
1,4
2016
2,8
2,7
2,2
0,9
0,3
0,4
2014
2,4
3,6
2013
3,6
Source: STATISTIK AUSTRIA, WIFO
2015
2012
2011
2010
2009
2008
2007
2006
2005
2004
2003
2002
2001
2000
1999
1998
1997
1996
-3,8
June 2016
2
�
5) AUSTRIAN ECONOMIC SITUATION AND OUTLOOK
1
+ 2,5
+ 3,1
+ 3,5
+ 2,8
+ 3,2
+ 3,9
+ 1,1
+ 1,6
+ 1,9
+ 3,1
+ 2,6
+ 2,9
+ 2,8
+ 0,2
- 3,6
+ 3,0
+ 2,0
+ 1,3
+ 1,2
+ 1,9
+ 2,1
+ 1,8
+ 2,1
Austria
OECD-
Countries 1
Euro Area 18
EU 28
Switzerland 1
.
+ 1,3
+ 1,8
+ 1,6
+ 1,6
+ 3,7
+ 1,8
+ 0,3
+ 0,2
+ 1,6
+ 0,9
+ 2,0
+ 1,5
- 1,0
- 5,5
+ 1,7
+ 0,6
- 2,8
- 1,7
- 0,3
+ 0,8
+ 1,0
+ 1,4
World
.
+ 0,8
+ 1,8
+ 2,0
+ 2,0
+ 3,0
+ 1,7
+ 0,0
- 0,7
+ 1,2
+ 0,7
+ 3,7
+ 3,3
+ 1,1
- 5,6
+ 4,1
+ 3,6
+ 0,4
+ 0,3
+ 1,6
+ 1,7
+ 1,6
+ 1,7
real change of GDP in %
+ 0,4
.
.
+ 0,5
+ 1,8
+ 1,6
+ 1,9
+ 2,7
+ 2,6
+ 2,8
+ 3,0
+ 2,9
+ 1,3
+ 3,0
+ 2,9
+ 3,7
+ 3,9
+ 3,8
+ 1,0
+ 2,2
+ 2,1
+ 0,3
+ 1,3
+ 0,9
- 0,2
+ 1,5
+ 0,6
+ 2,5
+ 2,5
+ 2,2
+ 2,6
+ 2,0
+ 1,7
+ 3,6
+ 3,4
+ 3,2
+ 3,6
+ 3,1
+ 3,0
+ 2,1
+ 0,5
+ 0,5
- 1,9
- 4,4
- 4,5
+ 3,0
+ 2,1
+ 2,0
+ 1,8
+ 1,7
+ 1,6
+ 1,1
- 0,5
- 0,9
+ 1,8
+ 0,2
- 0,3
+ 1,9
+ 1,4
+ 0,9
+ 0,8
+ 1,9
+ 1,6
+ 1,3
+ 1,8
+ 1,6
+ 1,6
+ 1,9
+ 1,7
China
+ 1,6
+ 3,5
+ 1,8
- 1,1
+ 0,1
+ 2,8
+ 0,2
+ 0,1
+ 1,4
+ 2,7
+ 1,9
+ 2,0
+ 2,4
- 1,0
- 5,5
+ 4,7
- 0,5
+ 1,7
+ 1,4
+ 0,0
+ 0,6
+ 0,5
+ 0,5
Italy
Japan
USA
+ 2,7
+ 3,8
+ 4,5
+ 4,4
+ 4,7
+ 4,1
+ 1,0
+ 1,8
+ 2,8
+ 3,8
+ 3,3
+ 2,7
+ 1,8
- 0,3
- 2,8
+ 2,5
+ 1,6
+ 2,2
+ 1,5
+ 2,4
+ 2,4
+ 1,8
+ 2,4
1995
1996
1997
1998
1999
2000
2001
2002
2003
2004
2005
2006
2007
2008
2009
2010
2011
2012
2013
2014
2015
2016
2017
Germany
International Growth Perspectives
+10,9
+10,0
+ 9,3
+ 7,8
+ 7,6
+ 8,4
+ 8,3
+ 9,1
+10,0
+10,1
+11,3
+12,7
+14,2
+ 9,6
+ 9,2
+10,4
+ 9,3
+ 7,7
+ 7,7
+ 7,3
+ 6,9
+ 6,0
+ 5,8
+ 3,7
+ 4,1
+ 4,2
+ 2,8
+ 3,8
+ 4,7
+ 2,3
+ 2,9
+ 3,6
+ 4,9
+ 4,6
+ 5,3
+ 5,4
+ 2,8
- 0,6
+ 5,2
+ 4,2
+ 3,5
+ 3,3
+ 3,4
+ 3,1
+ 3,0
+ 3,4
.
+ 2,4
+ 2,2
+ 3,6
+ 3,6
+ 3,4
+ 1,4
+ 1,7
+ 0,8
+ 2,7
+ 2,1
+ 3,4
+ 3,6
+ 1,5
- 3,8
+ 1,9
+ 2,8
+ 0,8
+ 0,3
+ 0,4
+ 0,9
+ 1,7
+ 1,7
according to IHS-forecast
Economic Growth 1996 - 2017
change of real GDP (in %)
Euro Area 18
OECDCountries
Austria
+20,0
+15,0
+10,0
+ 5,0
+ 0,0
- 5,0
Source: EUROSTAT, WIFO, IHS
2017
2016
2015
2014
2013
2012
2011
2010
2009
2008
2007
2006
2005
2004
2003
2002
2001
2000
1999
1998
1997
1996
-10,0
June 2016
3
�
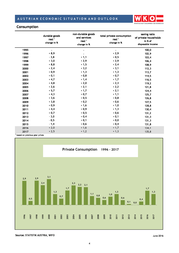
6) AUSTRIAN ECONOMIC SITUATION AND OUTLOOK
Consumption
non-durable goods
and services
real 1
durable goods
real 1
change in %
in % of
disposable income
.
+ 2,9
+ 0,5
+ 2,9
+ 2,4
+ 3,1
+ 1,3
+ 0,7
+ 1,7
+ 2,3
+ 2,2
+ 2,1
+ 1,1
+ 0,8
+ 0,6
+ 1,0
+ 1,3
+ 0,6
+ 0,1
+ 0,0
+ 0,4
+ 1,7
+ 1,3
100,0
102,9
103,4
106,4
108,9
112,3
113,7
114,5
116,5
119,2
121,8
124,4
125,7
126,8
127,5
128,8
130,4
131,2
131,3
131,3
131,8
134,1
135,8
.
.
+ 1,1
+ 2,9
+ 1,5
+ 3,2
+ 1,3
+ 0,8
+ 1,4
+ 2,0
+ 2,1
+ 1,7
+ 0,7
+ 0,5
+ 0,2
+ 1,6
+ 0,9
+ 0,5
+ 0,4
+ 0,1
+ 0,6
+ 1,6
+ 1,2
based on previous year prices
Private Consumption
3,1
2,4
2,3
2,2
2,1
1,7
1,7
1,3
1,0
0,6
0,6
0,4
Source: STATISTIK AUSTRIA, WIFO
2012
2011
2010
2009
2008
2007
2006
2005
2004
2003
2002
2001
2000
1999
1998
1997
1996
0,1
0,0
2015
0,5
0,8
2014
1,1
0,7
1,3
2013
1,3
2017
2,9
2,9
1996 - 2017
2016
1
saving ratio
of private households
change in %
change in %
.
+ 8,9
- 3,8
+ 3,0
+ 8,8
+ 2,4
+ 0,9
+ 0,1
+ 4,7
+ 4,8
+ 2,6
+ 5,7
+ 4,3
+ 3,6
+ 3,8
+ 0,9
+ 4,4
+ 0,7
- 3,0
- 0,5
- 1,4
+ 2,0
+ 2,5
1995
1996
1997
1998
1999
2000
2001
2002
2003
2004
2005
2006
2007
2008
2009
2010
2011
2012
2013
2014
2015
2016
2017
total private consumption
real 1
June 2016
4
�
7) AUSTRIAN ECONOMIC SITUATION AND OUTLOOK
Investment
machinery &
equipment 1
real 2
change in %
change in %
1
including other investment
2
gross fixed
capital formation
real 2
Index 1995=100
change in %
.
+ 8,9
+ 0,4
+ 4,2
+ 0,3
+10,0
- 0,9
- 5,1
+ 2,8
- 1,0
+ 1,5
+ 1,2
+ 8,6
+ 2,5
-11,3
- 1,2
+10,1
+ 0,7
- 0,1
+ 1,3
+ 3,1
+ 3,2
+ 2,7
1995
1996
1997
1998
1999
2000
2001
2002
2003
2004
2005
2006
2007
2008
2009
2010
2011
2012
2013
2014
2015
2016
2017
gross fixed
capital formation
total
real 2
construction
real 2
.
+ 1,3
- 0,4
+ 0,9
- 0,1
+ 2,5
- 4,1
- 3,8
+ 5,2
+ 1,7
- 1,1
- 1,1
+ 1,9
+ 0,1
- 8,1
- 4,6
+ 2,7
+ 2,2
- 2,1
- 1,0
- 1,2
+ 1,0
+ 1,4
.
+ 4,4
+ 0,7
+ 3,4
+ 1,2
+ 5,9
- 1,3
- 2,9
+ 3,8
+ 0,9
+ 0,2
+ 1,1
+ 4,6
+ 1,4
- 7,3
- 2,1
+ 6,7
+ 1,3
- 0,3
- 0,2
+ 0,5
+ 1,9
+ 2,0
100,0
104,4
105,1
108,6
109,9
116,3
114,9
111,5
115,7
116,8
117,1
118,4
123,8
125,6
116,4
114,0
121,6
123,2
122,9
122,6
123,2
125,6
128,1
based on previous year prices
Capital Formation 1996 - 2017
real change (in %)
+10,0
+ 8,0
+ 6,0
+ 4,0
+ 2,0
+ 0,0
- 2,0
- 4,0
- 6,0
- 8,0
Source: STATISTIK AUSTRIA, WIFO
2017
2016
2015
2014
2013
2012
2011
2010
2009
2008
2007
2006
2005
2004
2003
2002
2001
2000
1999
1998
1997
1996
-10,0
June 2016
5
�
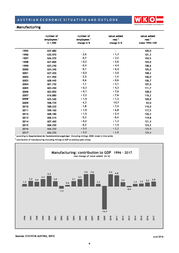
8) AUSTRIAN ECONOMIC SITUATION AND OUTLOOK
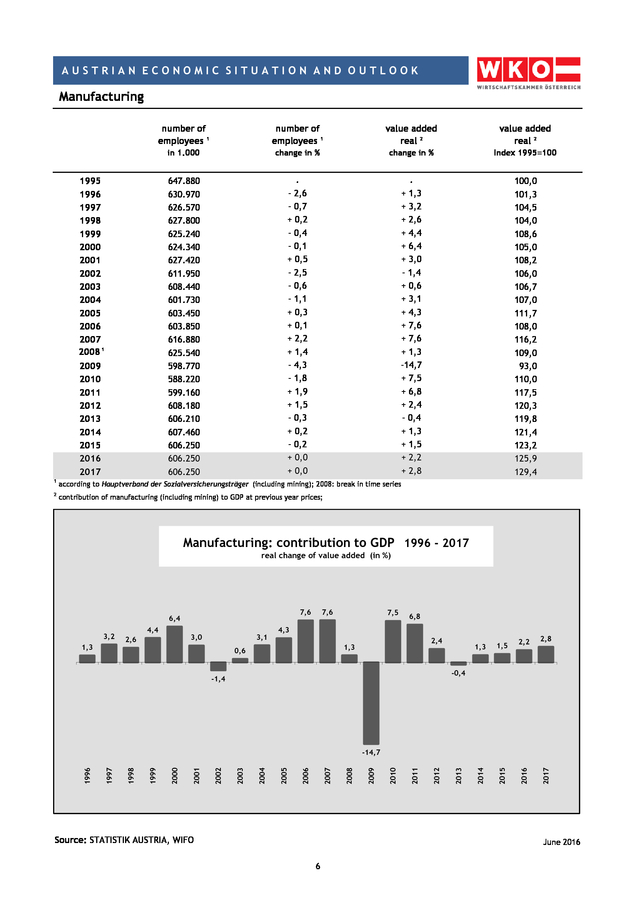
Manufacturing
number of
employees 1
number of
employees 1
value added
real 2
value added
real 2
in 1.000
change in %
change in %
Index 1995=100
647.880
630.970
626.570
627.800
625.240
624.340
627.420
611.950
608.440
601.730
603.450
603.850
616.880
625.540
598.770
588.220
599.160
608.180
606.210
607.460
606.250
606.250
606.250
.
- 2,6
- 0,7
+ 0,2
- 0,4
- 0,1
+ 0,5
- 2,5
- 0,6
- 1,1
+ 0,3
+ 0,1
+ 2,2
+ 1,4
- 4,3
- 1,8
+ 1,9
+ 1,5
- 0,3
+ 0,2
- 0,2
+ 0,0
+ 0,0
.
+ 1,3
+ 3,2
+ 2,6
+ 4,4
+ 6,4
+ 3,0
- 1,4
+ 0,6
+ 3,1
+ 4,3
+ 7,6
+ 7,6
+ 1,3
-14,7
+ 7,5
+ 6,8
+ 2,4
- 0,4
+ 1,3
+ 1,5
+ 2,2
+ 2,8
100,0
101,3
104,5
104,0
108,6
105,0
108,2
106,0
106,7
107,0
111,7
108,0
116,2
109,0
93,0
110,0
117,5
120,3
119,8
121,4
123,2
125,9
129,4
1995
1996
1997
1998
1999
2000
2001
2002
2003
2004
2005
2006
2007
2008 1
2009
2010
2011
2012
2013
2014
2015
2016
2017
1
according to Hauptverband der Sozialversicherungsträger (including mining); 2008: break in time series
2
contribution of manufacturing (including mining) to GDP at previous year prices;
Manufacturing: contribution to GDP 1996 - 2017
real change of value added (in %)
6,8
1,3
1,5
2,2
2,8
2017
2,4
1,3
0,6
2016
4,3
2015
3,1
3,0
2,6
7,5
2014
3,2
1,3
4,4
7,6
7,6
6,4
-0,4
-1,4
Source: STATISTIK AUSTRIA, WIFO
2013
2012
2011
2010
2009
2008
2007
2006
2005
2004
2003
2002
2001
2000
1999
1998
1997
1996
-14,7
June 2016
6
�
9) AUSTRIAN ECONOMIC SITUATION AND OUTLOOK
Foreign Trade
exports of goods
imports of goods
current prices
real
current prices
real
change to previous year in %
.
+ 5,5
+16,8
+ 8,4
+ 7,0
+15,6
+ 6,5
+ 4,2
+ 1,9
+13,9
+ 5,4
+ 9,5
+10,5
+ 2,5
-20,2
+16,7
+11,3
+ 1,5
+ 1,8
+ 1,8
+ 2,7
+ 2,6
+ 5,3
1995
1996
1997
1998
1999
2000
2001
2002
2003
2004
2005
2006
2007
2008
2009
2010
2011
2012
2013
2014
2015
2016
2017
.
+ 4,5
+16,6
+ 8,3
+ 7,6
+13,3
+ 6,3
+ 4,7
+ 2,5
+12,7
+ 3,2
+ 6,4
+ 8,9
+ 0,5
-17,7
+13,1
+ 7,4
+ 0,5
+ 2,9
+ 2,7
+ 2,2
+ 2,5
+ 4,5
.
+ 6,7
+10,9
+ 6,6
+ 6,7
+14,7
+ 5,0
- 2,0
+ 5,0
+12,5
+ 5,9
+ 8,0
+ 9,6
+ 4,7
-18,4
+16,5
+15,3
+ 0,7
- 1,0
- 0,7
+ 2,4
+ 2,8
+ 5,1
.
+ 4,5
+ 9,2
+ 6,9
+ 6,5
+11,9
+ 5,7
- 0,7
+ 6,7
+10,7
+ 2,9
+ 3,9
+ 7,8
+ 0,8
-13,3
+10,7
+ 8,4
- 0,9
- 0,1
+ 1,0
+ 4,0
+ 3,3
+ 4,2
Exports and imports of goods 1996 - 2017
at current prices, change (in %)
+18,0
+13,0
+ 8,0
+ 3,0
- 2,0
- 7,0
-12,0
-17,0
-22,0
exports
imports
Source: STATISTIK AUSTRIA, WIFO
2017
2016
2015
2014
2013
2012
2011
2010
2009
2008
2007
2006
2005
2004
2003
2002
2001
2000
1999
1998
1997
1996
-27,0
June 2016
7
�
10) AUSTRIAN ECONOMIC SITUATION AND OUTLOOK
Balance of payments
deficit/surplus, billion EUR
foreign trade
tourism
others
current account
balance
- 5,99
- 6,73
- 5,12
- 4,50
- 4,48
- 4,34
- 3,61
+ 1,35
- 1,54
- 0,56
- 1,05
+ 2,57
+ 3,90
+ 1,57
- 0,49
- 1,38
- 3,63
- 3,16
- 1,00
+ 1,56
+ 2,64
+ 2,42
+ 2,82
+ 4,04
+ 3,61
+ 3,11
+ 3,37
+ 3,75
+ 3,83
+ 3,68
+ 4,29
+ 4,28
+ 4,73
+ 5,40
+ 5,84
+ 6,14
+ 7,06
+ 6,23
+ 6,41
+ 6,96
+ 7,00
+ 7,51
+ 7,42
+ 8,49
+ 9,07
+ 9,50
- 3,12
- 2,08
- 2,54
- 2,01
- 2,60
- 1,01
- 1,83
+ 0,23
+ 1,04
+ 0,99
+ 0,96
+ 1,31
+ 2,38
+ 7,37
+ 3,78
+ 6,61
+ 5,67
+ 8,25
+ 2,24
- 2,60
- 2,49
- 1,94
- 0,84
current account
balance
- 5,06
- 5,20
- 4,55
- 3,15
- 3,32
- 1,53
- 1,75
+ 5,87
+ 3,78
+ 5,15
+ 5,31
+ 8,82
+10,80
+13,21
+ 7,49
+ 8,45
+ 5,06
+ 4,73
+ 6,29
+ 6,38
+ 8,64
+ 9,55
+11,48
1995
1996
1997
1998
1999
2000
2001
2002
2003
2004
2005
2006 1
2007
2008
2009
2010
2011
2012
2013
2014
2015
2016
2017
1
-2,9
-2,9
-2,4
-1,6
-1,6
-0,7
-0,8
2,6
1,6
2,1
2,1
3,3
3,8
4,5
2,6
2,9
1,6
1,5
1,9
1,9
2,6
2,7
3,2
2006 : break in time series
*
% of GDP
2006: neues Erhebungskonzept; Daten 1995-2005 rückgerechnet
Current Account Balance 1995 - 2017 - billion EURO
13,21
11,48
10,80
8,82
7,49
5,87
8,64
8,45
9,55
6,29 6,38
5,15 5,31
5,06 4,73
3,78
-1,53 -1,75
-3,15 -3,32
2017
2016
2015
2014
2013
2012
2011
2010
2009
2008
2007
2006*
2005
2004
2003
2002
2001
2000
1999
1998
-4,55
1997
1996
1995
-5,06 -5,20
* 2006 : break in time series
Source: STATISTIK AUSTRIA, WIFO
June 2016
8
�
11) AUSTRIAN ECONOMIC SITUATION AND OUTLOOK
Public finances
public financial balances (deficit/surplus)
general government (Maastricht definition)
primary financial balance *
billion EUR
1
billion EUR
% of GDP
-10,83
- 7,94
- 4,50
- 5,34
- 5,28
- 4,37
- 1,36
- 3,04
- 4,08
-11,54
- 6,35
- 6,66
- 3,72
- 4,23
-15,22
-13,10
- 7,89
- 6,88
- 4,16
- 8,89
- 4,05
- 5,93
- 5,42
1995
1996
1997
1998
1999
2000
2001
2002
2003
2004
2005
2006
2007
2008
2009
2010
2011
2012
2013
2014
2015
2016
2017
% of GDP
- 6,1
- 4,4
- 2,4
- 2,7
- 2,6
- 2,0
- 0,6
- 1,3
- 1,8
- 4,8
- 2,5
- 2,5
- 1,3
- 1,4
- 5,3
- 4,5
- 2,6
- 2,2
- 1,3
- 2,7
- 1,2
- 1,7
- 1,5
- 3,77
- 0,77
+ 2,30
+ 1,69
+ 1,72
+ 3,24
+ 6,60
+ 4,77
+ 3,29
- 4,25
+ 1,83
+ 1,73
+ 5,18
+ 4,42
- 6,18
- 4,56
+ 0,72
+ 1,74
+ 4,23
- 0,70
+ 4,00
+ 1,70
+ 1,40
- 2,1
- 0,4
+ 1,2
+ 0,9
+ 0,8
+ 1,5
+ 3,0
+ 2,1
+ 1,4
- 1,8
+ 0,7
+ 0,6
+ 1,8
+ 1,5
- 2,2
- 1,5
+ 0,2
+ 0,6
+ 1,3
- 0,2
+ 1,2
+ 0,5
+ 0,4
except interest payment for public debt
Public Deficit 1995 - 2017
net lending (Maastricht-definition), % of GDP
+ 1,0
+ 0,0
- 1,0
- 2,0
- 3,0
- 4,0
- 5,0
- 6,0
Source: STATISTIK AUSTRIA, WIFO
2017
2016
2015
2014
2013
2012
2011
2010
2009
2008
2007
2006
2005
2004
2003
2002
2001
2000
1999
1998
1997
1996
1995
- 7,0
June 2016
9
�
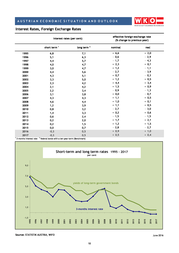
12) AUSTRIAN ECONOMIC SITUATION AND OUTLOOK
Interest Rates, Foreign Exchange Rates
effective foreign-exchange rate
(% change to previous year)
interest rates (per cent)
short term 1
long term 2
6,8
5,1
4,4
4,0
3,0
4,4
4,3
3,3
2,3
2,1
2,2
3,1
4,3
4,6
1,2
0,8
1,4
0,6
0,2
0,2
0,0
-0,3
-0,3
7,1
6,3
5,7
4,7
4,7
5,6
5,1
5,0
4,2
4,2
3,4
3,8
4,3
4,4
3,9
3,2
3,3
2,4
2,0
1,5
0,7
0,5
0,5
1995
1996
1997
1998
1999
2000
2001
2002
2003
2004
2005
2006
2007
2008
2009
2010
2011
2012
2013
2014
2015
2016
2017
1
3-months interest rate
2
nominal
+
+
+
+
+
+
+
+
+
+
+
+
+
+
+
+
real
6,6
0,6
1,7
2,3
1,2
2,7
0,7
1,2
4,4
1,5
0,9
0,0
1,1
1,0
1,1
2,7
0,2
1,5
1,7
1,2
2,8
0,9
0,5
+
+
+
+
+
+
+
+
+
+
+
+
+
2,0
2,9
4,3
0,1
1,1
3,9
0,3
0,5
3,4
0,9
1,3
0,7
0,5
0,1
0,5
3,0
0,6
1,5
2,1
1,5
2,7
1,0
0,4
federal bonds with a ten-year-term (Benchmark)
Short-term and long term rates 1995 - 2017
per cent
9,0
7,0
yields of long-term government bonds
5,0
3,0
1,0
3-months interest rate
Source: STATISTIK AUSTRIA, WIFO
2017
2016
2015
2014
2013
2012
2011
2010
2009
2008
2007
2006
2005
2004
2003
2002
2001
2000
1999
1998
1997
1996
1995
-1,0
June 2016
10
�
13) AUSTRIAN ECONOMIC SITUATION AND OUTLOOK
Employment
employees
foreign workers
number (1 000)
change, 1 000
change, %
number (1 000)
2.962,7
2.946,1
2.956,6
2.989,0
3.026,2
3.054,4
3.066,9
3.051,9
3.057,4
3.078,5
3.110,4
3.161,9
3.227,4
3.283,0
3.234,5
3.260,0
3.323,3
3.370,5
3.391,7
3.415,5
3.448,7
3.496,7
3.538,7
+ 1,9
-16,6
+10,5
+32,4
+37,2
+28,2
+12,4
-15,0
+ 5,5
+21,1
+31,9
+51,5
+65,5
+55,6
-48,5
+25,5
+63,3
+47,2
+21,2
+23,8
+33,2
+48,0
+42,0
+ 0,1
- 0,6
+ 0,4
+ 1,1
+ 1,2
+ 0,9
+ 0,4
- 0,5
+ 0,2
+ 0,7
+ 1,0
+ 1,7
+ 2,1
+ 1,7
- 1,5
+ 0,8
+ 1,9
+ 1,4
+ 0,6
+ 0,7
+ 1,0
+ 1,4
+ 1,2
300,3
300,4
298,8
298,6
305,8
319,4
329,3
334,1
349,6
361,8
373,7
389,9
411,7
437,1
431,6
451,3
488,9
527,1
556,7
588,7
615,7
650,7
683,7
1995
1996
1997
1998
1999
2000
2001
2002
2003
2004
2005
2006
2007
2008 2
2009
2010
2011
2012
2013
2014
2015
2016
2017
1
according to HVSV (without receivers of maternity leave allowance and people doing their military service)
2
break in time series
Employment 1995 - 2017
number of employees, change in thousands
65,5
51,5
32,4
37,2
42,0
33,2
25,5
21,1
12,4
48,0
47,2
31,9
28,2
10,5
63,3
55,6
23,8
5,5
1,9
-15,0
-16,6
2017
2016
2015
2014
2013
2012
2011
2010
2009
2008 *
2007
2006
2005
2004
2003
2002
2001
2000
1999
1998
1997
1996
1995
-48,5
* break in time series
Source: STATISTIK AUSTRIA, WIFO
June 2016
11
�
14) AUSTRIAN ECONOMIC SITUATION AND OUTLOOK
Unemployment
registered unemployment (1 000) 1
unemployment rate
number (1 000)
annual change
(1 000)
% of employees
215,7
230,5
233,3
237,8
221,7
194,3
203,9
232,4
240,1
243,9
252,7
239,2
222,2
212,3
260,3
250,8
246,7
260,6
287,2
319,4
354,3
364,3
383,3
+ 0,8
+ 14,8
+ 2,8
+ 4,5
- 16,1
- 27,4
+ 9,6
+ 28,5
+ 7,7
+ 3,8
+ 8,8
- 13,5
- 17,0
- 9,9
+ 48,0
- 9,5
- 4,1
+ 13,9
+ 26,6
+ 32,2
+ 35,0
+ 10,0
+ 19,0
6,6
7,0
7,1
7,2
6,7
5,8
6,1
6,9
7,0
7,1
7,3
6,8
6,2
5,9
7,2
6,9
6,7
7,0
7,6
8,4
9,1
9,2
9,6
1995
1996
1997
1998
1999
2000
2001
2002
2003
2004
2005
2006
2007
2008
2009
2010
2011
2012
2013
2014
2015
2016
2017
1
according to Arbeitsmarktservice
2
% of labour force 2
1
4,2
4,7
4,7
4,7
4,2
3,9
4,0
4,4
4,8
5,5
5,6
5,3
4,9
4,1
5,3
4,8
4,6
4,9
5,4
5,6
5,7
5,9
6,1
EUROSTAT-definition (survey-based data; saisonal adjusted)
Unemployment rate 1995 - 2017
9,1
9,2
2015
2016
according to AMS (registered unemployment)
9,6
8,4
7,2
6,8
6,7
7,0
2017
2014
2013
2012
5,9
2011
2006
2005
Source: AMS, STATISTIK AUSTRIA, WIFO
7,6
6,9
2010
6,2
2009
7,3
6,1
2004
2000
1999
1998
1997
1996
1995
5,8
7,1
2007
6,7
7,0
2008
6,9
2003
7,2
2002
7,1
2001
6,6
7,0
June 2016
12
�
15) AUSTRIAN ECONOMIC SITUATION AND OUTLOOK
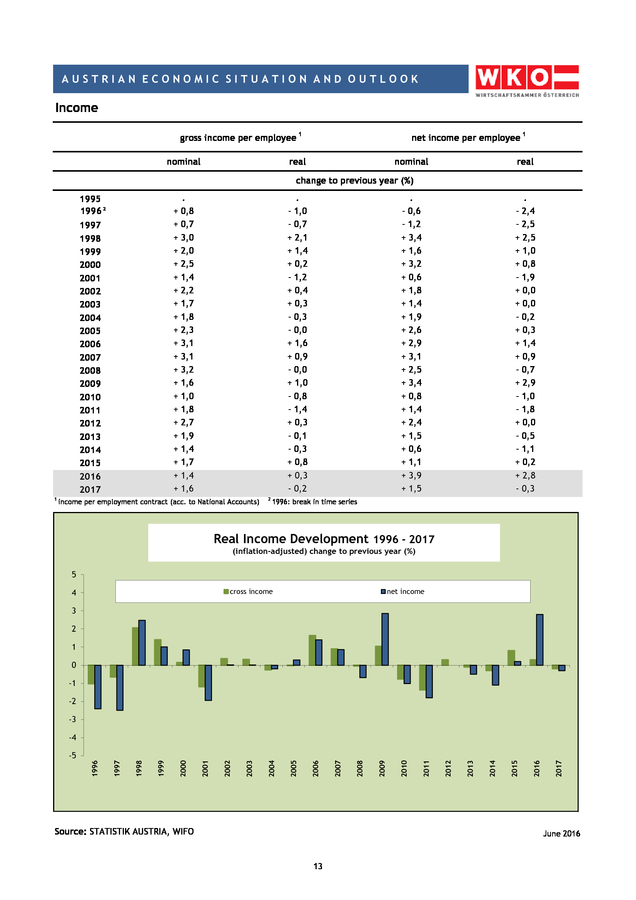
Income
gross income per employee 1
nominal
net income per employee 1
real
nominal
real
change to previous year (%)
.
+ 0,8
+ 0,7
+ 3,0
+ 2,0
+ 2,5
+ 1,4
+ 2,2
+ 1,7
+ 1,8
+ 2,3
+ 3,1
+ 3,1
+ 3,2
+ 1,6
+ 1,0
+ 1,8
+ 2,7
+ 1,9
+ 1,4
+ 1,7
+ 1,4
+ 1,6
1995
1996 2
1997
1998
1999
2000
2001
2002
2003
2004
2005
2006
2007
2008
2009
2010
2011
2012
2013
2014
2015
2016
2017
1
.
- 1,0
- 0,7
+ 2,1
+ 1,4
+ 0,2
- 1,2
+ 0,4
+ 0,3
- 0,3
- 0,0
+ 1,6
+ 0,9
- 0,0
+ 1,0
- 0,8
- 1,4
+ 0,3
- 0,1
- 0,3
+ 0,8
+ 0,3
- 0,2
income per employment contract (acc. to National Accounts)
2
.
- 0,6
- 1,2
+ 3,4
+ 1,6
+ 3,2
+ 0,6
+ 1,8
+ 1,4
+ 1,9
+ 2,6
+ 2,9
+ 3,1
+ 2,5
+ 3,4
+ 0,8
+ 1,4
+ 2,4
+ 1,5
+ 0,6
+ 1,1
+ 3,9
+ 1,5
.
- 2,4
- 2,5
+ 2,5
+ 1,0
+ 0,8
- 1,9
+ 0,0
+ 0,0
- 0,2
+ 0,3
+ 1,4
+ 0,9
- 0,7
+ 2,9
- 1,0
- 1,8
+ 0,0
- 0,5
- 1,1
+ 0,2
+ 2,8
- 0,3
1996: break in time series
Real Income Development 1996 - 2017
(inflation-adjusted) change to previous year (%)
5
cross income
4
net income
3
2
1
0
-1
-2
-3
Source: STATISTIK AUSTRIA, WIFO
2017
2016
2015
2014
2013
2012
2011
2010
2009
2008
2007
2006
2005
2004
2003
2002
2001
2000
1999
1998
1997
-5
1996
-4
June 2016
13
�
16) AUSTRIAN ECONOMIC SITUATION AND OUTLOOK
Inflation
inflation rate
price development 1
Index 1995=100
.
.
1,1
1,2
0,7
0,9
2,3
2,0
1,3
1,6
1,5
1,3
1,9
2,4
1,5
1,2
2,8
2,3
2,3
1,9
1,7
1,6
1,6
2,2
1,9
1,3
0,9
0,6
2,3
2,7
1,8
1,3
2,1
2,3
1,5
2,2
3,2
0,5
1,9
3,3
2,4
2,0
1,7
0,9
1,1
1,8
1995
1996
1997
1998
1999
2000
2001
2002
2003
2004
2005
2006
2007
2008
2009
2010
2011
2012
2013
2014
2015
2016
2017
1
consumer price index according to national calculation
3
Harmonized
consumer price index 3
core inflation 2
100,0
101,9
103,2
104,2
104,8
107,2
110,1
112,1
113,5
115,9
118,6
120,3
123,0
126,9
127,6
130,0
134,3
137,5
140,3
142,6
143,9
145,5
148,1
change of
consumer price index 1
change (%)
2
change (%)
1,7
1,7
1,2
0,8
0,5
2,0
2,3
1,7
1,3
2,0
2,1
1,7
2,2
3,2
0,4
1,7
3,6
2,6
2,1
1,5
0,8
1,1
1,8
HCPI: Europe-wide standardized consumer price index
without energy and unprocessed food
Inflation rate 1995 - 2017
change of consumer price index (%)
3,3
3,2
2,7
2,3
2,1
1,9
2,3
2,4
2,2
1,3
2,0
1,9
1,8
1,3
0,9
0,9
1,1
Source: STATISTIK AUSTRIA, WIFO
2017
2015
2014
2013
2012
2011
2010
2009
2008
2007
2006
2005
2004
2003
2002
2001
0,5
2000
1999
1998
1997
1996
0,6
1995
1,8
1,7
1,5
2016
2,2
June 2016
14
�